2020 U.S. Power Report Card: Good Marks for Solar & Wind
The U.S. power sector in 2020 made big strides in wind and solar, accompanied by a decrease in retail electricity usage due to COVID-19 and a decrease in overall emissions— but we still have work to do.


It’s official: renewable resources surpassed coal in 2020 to become the third-largest source of electricity nationwide according to new government data. Continuing their promising trends from 2019, solar and wind energy again made strong gains across multiple states, accompanied by a steep reduction in total power sector pollution. But we still have work to do—fossil (aka “natural”) gas generation also increased last year and continues to be the nation’s primary source of electricity generation.
These key energy trends were gathered from year-end electricity data recently released by the U.S. Energy Information Administration. It provides a first, official state-by-state look at our electricity generation mix for last year and a roadmap for the future.
Here are four key statistics detailing 2020 U.S. power sector energy trends:
1. Utility-scale and small-scale solar photovoltaic (PV) generation grew by 25 percent year-over-year while wind generation increased 14 percent.
Despite a global pandemic that adversely impacted America to its core, last year was a record one for wind and solar. The U.S. added 14 gigawatts (GW) of wind, 10 GW of utility scale solar, and 4.5 GW of small-scale solar, finally pushing renewables past coal. This is nearly double the wind installations and more than twice the solar installations in 2019.
As shown in the table, California, Texas, and Florida were the top three states in newly added solar generating capacity in 2020. The middle of the country continues to be a popular place for wind energy—Texas, Iowa, and Oklahoma led in installations. Keep in mind that each gigawatt (GW) of wind and solar can power around 350,000 and 200,000 homes a year, respectively.

Top 5 States for New Wind and Solar Additions
Building a new wind or solar facility is now often cheaper than running an existing coal plant: Lazard estimates the levelized cost of a new wind plant is as low as $26/megawatt-hour (MWh) (or $9/MWh with the recently extended Production Tax Credit), while new utility-scale solar is as low as $31/MWH (or $26/MWh with the Investment Tax Credit). In comparison, the average marginal cost of running an existing coal plant is $41/MWh.
2. The pandemic significantly impacted commercial and industrial electricity demand, contributing to an 8 percent dip between March and June when compared to pre-COVID forecasts.
When looking at the total (residential, commercial, and industrial) month-by-month comparison of U.S. retail electricity use between actual data and pre-COVID projections, there is a clear dip in demand (by 4 percent) between March and June that aligns with the pandemic’s early months.
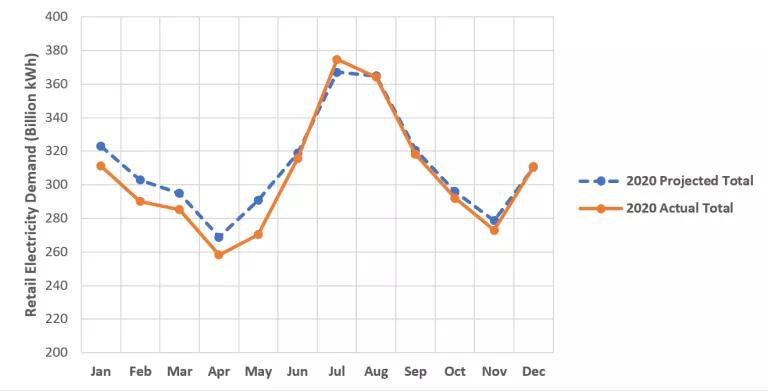
Total Retail Electricity Demand
As expected, electricity demand for the commercial and industrial sectors was significantly less—13 percent below the May projections.

Commercial and Industrial Retail Electricity Demand
The story is different with residential electricity, which saw a 2 percent uptick in demand due to stay-at-home orders and remote work. Unfortunately, the time when electricity was most needed was also when people were losing jobs and facing a recession, placing millions of low-income and recently unemployed people at risk for utility shutoffs. By the end of 2020, it was estimated that utility customers owed up to $40 billion in overdue bills. NRDC continues to push for bill relief and utility service shutoff moratoriums to ensure every U.S. household has affordable electricity in these uncertain times.

Residential Retail Electricity Demand
3. Power sector carbon emissions dropped 11 percent, decreasing 41 percent since 2005.
With increasing renewable output and decreasing demand related to the impacts of COVID 19, we saw a corresponding 11 percent decline in power-related carbon dioxide pollution (CO2) as well as other harmful air pollutants from coal- and gas-burning facilities.
Health-harming nitrogen oxide (NOx) and sulfur dioxide (SO2) emissions decreased by around 19 percent and 16 percent, respectively. SO2, which come from coal plants, and NOx emitted by both coal and gas plants, are public-health pollutants that contribute to an estimated tens of thousands of U.S. deaths every year. The dollar value benefit of the decrease in NOx and SO2 pollution in 2020—reflecting the benefit of avoided deaths, ER visits, respiratory events, and lost school and work days—is estimated at between $6 and $14 billion.

The U.S. has already exceeded the 2030 Clean Power Plan target.
4. Coal generation decreased a whopping 20 percent, but gas generation increased 2 percent, growing to 40 percent of the electricity mix.
Due to the poor economics of the aging coal fleet and flagging electricity demand, coal generation plummeted in 2020, driven not only by the continued retirement of coal plants, but also because of reduced use of plants still online. The average coal plant was only running in 40 percent of all hours, an all-time low, despite being built as “baseload” resources designed to operate 80 percent of the time.

Top 5 States with Largest Decrease in Coal Generation
However, fossil fuels still power a large part of our grid: coal and gas combined accounted for almost 60 percent of U.S. generation last year. And even as we have grown clean energy, we have not cut our dependence on fossil fuels. In 1990, coal and gas made up 65 percent of the U.S. electricity mix. Their share has only decreased 5 percent in the last 30 years. To meet President Biden’s 100 percent clean by 2035 target, we must eliminate all 60 percent of the coal and gas (operating without carbon capture today) in half that amount of time.

2020 U.S. Electricity Mix
Gas has a host of environmental, ecological, and health problems. Fracking harms both our communities and the environment by contaminating air and drinking water, while also ruining landscapes and even causing earthquakes. Gas, while producing less carbon pollution than coal at the smokestack, emits large amounts of methane, a potent GHG, in its extraction and delivery processes such that our increased reliance on gas has exacerbated climate change in recent years.
The Biden administration can jumpstart clean energy.
The fight to get the U.S. to reach a clean energy economy and cut climate pollution to net zero by 2050 starts with fully decarbonizing the power sector. Last year showed good momentum, but we need to continue to advocate for ambitious policy frameworks to accelerate the transition to clean energy, creating thousands of jobs for Americans and making our country (and air) even cleaner in 2021.
Related Blogs

Southeast at a Crossroads: Bad Gas Bet or Clean Energy Boon?

EPA’s Power Plant Standards: Just the Facts