
The Power of Measurement, Part II: Projected Freshwater Inflow to the San Francisco Bay Estuary with the Bay Delta Conservation Plan
If your doctor, or even the pharmacist at your local drug store, measured your blood pressure, found that it was higher than what modern medicine tells us is healthy, and advised you to lose weight, get more exercise and reduce your salt intake, what would you do?
Measurements like this can be life savers—but they only have power if you actually measure them and, when they indicate a problem, if you act on them.
In my last post, I described updated results of measurements, or indicators, developed for the San Francisco Estuary Partnership’s 2011 State of the Bay report. These measurements revealed a long-term and ongoing decline in the amount of freshwater inflow to San Francisco Bay, resulting in the estuary—the largest on the West Coast—experiencing chronic man-made drought conditions and predictable drops in fish populations.
These results are disappointing but not unexpected: concern about reductions in freshwater inflow to the Bay goes back to the 1970s. Back in 1993, following years of research, workshops and hearings, the San Francisco Estuary Partnership adopted a Comprehensive Conservation and Management Plan that included the goal to “increase freshwater availability to the Estuary” (page 109 in the 2007 update). But, even as the 2011 State of the Bay report and my updated indicators documented failure to meet the goal (or even to make any progress), there is strong consensus that improved inflows are necessary to protect and restore the Bay and its upstream Delta. In just the past three years, the State Water Resources Control Board (page 5), the U.S. Environmental Protection Agency (page 10), the Association of Bay Area Governments, the Public Policy Institute of California (page 5), and extensive surveys of scientists (figures 1, 2 and 3) have all concluded that freshwater inflows need to be increased.
So how will the Bay Delta Conservation Plan, described as “part of California’s overall water management portfolio” and “a 50-year habitat conservation plan,” address this need?
The plan, which was just released for formal public review, includes two alternative scenarios for managing water exports from the Delta and freshwater inflows to the estuary, a Low Outflow Scenario (LOS) and a High Outflow Scenario (HOS). (Note: Freshwater inflow to the Bay is also referred to as “Delta outflow.”) With thanks to Greg Reis of The Bay Institute for compiling the data from the Administrative Draft version of the plan documents, I used the two freshwater inflow indicators and the Bay Delta Conservation Plan’s projected flow data for their “high outflow” and “low outflow” scenarios to measure how the plan would compare to actual freshwater inflow conditions.
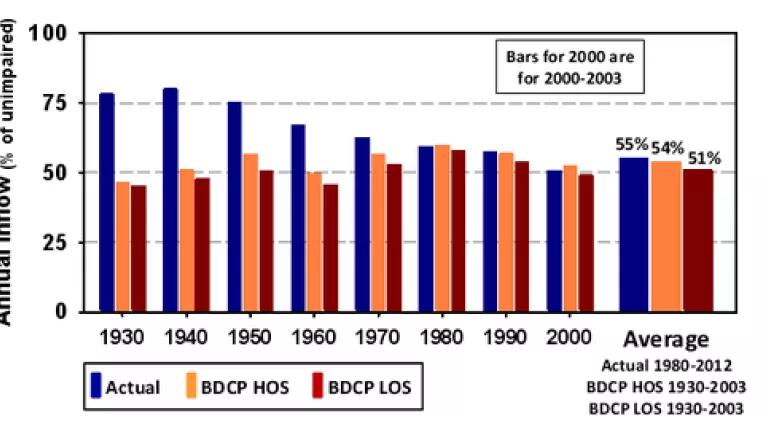
This graph compares the actual freshwater inflows to the estuary, expressed as the average percentage of estimated unimpaired inflow for each decade, with inflows predicted under the Bay Delta Conservation Plan’s high and low outflow scenarios. The last trio of bars shows the longer term averages, using 1980-2012 for actual flows and the 1930-2003 period used in the plan’s analyses for the high and low outflow scenarios. (Before 1980, dams and water diversion facilities in the watershed and Delta were not operated at full capacity, so quantitative comparison of historical actual flows with the plan’s projected flows for those early years is not useful.)
The results show that, despite its name, the high outflow scenario is anything but. At best it perpetuates the status quo with inflow to the estuary reduced by nearly 50%; at worst, it’s slightly worse than conditions that have already driven the Delta to collapse. The low outflow scenario is, put simply, just plain worse.
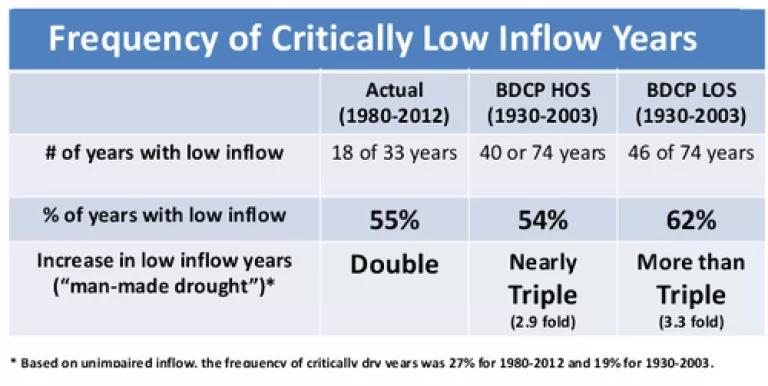
This table compares the frequency of critically low inflow years, or drought conditions, for actual inflows during the 1980-2012 period, during which 27% of the years were naturally dry, and for the 64-year period analyzed for the high outflow and low outflow scenarios (1930-2003, during which 19% of the years were naturally dry).
During the past 33 years, actual water management operations have doubled the frequency of drought conditions in the Bay. But, under the Bay Delta Conservation Plan, the frequency of critically low annual inflows would triple, reaching 62% of all years under the low outflow scenario.
Since Delta fishes, which are affected by flow as well as other factors, have consistently experienced substantial population declines during periods with multiple years of low inflows, it’s hard to understand how the Bay Delta Conservation Plan can meet its objectives to restore the ecosystem and contribute to the recovery of the numerous already endangered fishes that live in the estuary.
Unfortunately, the Bay Delta Conservation Plan is not unique in its failure to use measurements like these, also called “performance measures,” to test and evaluate its plan. In a recent article, Dr. Judy Meyer, an ecologist from University of Georgia and member of the Delta Independent Science Board, which has already critically reviewed the plan several times, said this:
“Having observed the science–policy interface in the Delta for over a decade, I have concluded that implementation of a limited and carefully chosen suite of performance measures is a crucial missing link in the adaptive management cycle.”
I still believe in the power of measurement—but I also recognize that, when the responsible agencies fail or are unwilling to use them, it can fall to others, like the San Francisco Estuary Partnership, to bring to light the important evidence such measurements provide. Rescuing the San Francisco Bay estuary and managing its water resources for both human and ecosystem benefits is important and has broad public and political support. It’s time to put the facts on the table, identify the real problems, set reasonable and balanced goals, and get to work.