

With landmark new automobile fuel efficiency standards expected to be released this month, NRDC teamed up with the BlueGreen Alliance to provide a state-by-state breakdown of projected jobs created, fuel saved by consumers and carbon pollution avoided.
The results are impressive. Individual states will create tens of thousands of jobs and save billions in fuel costs.
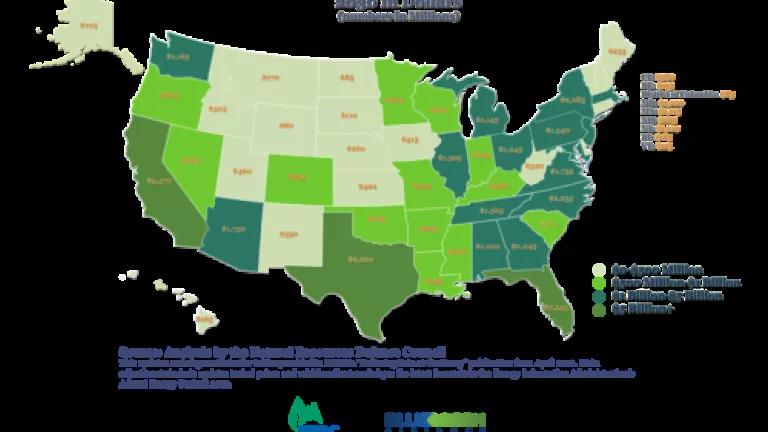
The benefits described graphically and in a table below are for the year 2030 and are the result of ramping up fuel efficiency over model years 2017 to 2025, from the equivalent of 35.5 miles per gallon to 54.5 miles per gallon. (If I included the current 2012-2016 standards, the fuel and pollution reduction benefits of the full 2012-2025 vehicle efficiency program would be more than twice the values listed here.)
A recent study by the BlueGreen Alliance found that an estimated 570,000 jobs would be created by 2030 nationwide. As I described in a recent post (More MPG = More Jobs), adding more fuel-saving technology to cars and trucks grows auto industry jobs. Also the fuel savings that consumers reap from fewer trips to the pump are spent in the wider economy, spurring job creation. The BlueGreen Alliance analysis is the source of the state-level estimates of the jobs created by 2030. (Note, however, that we don’t have to wait for 2030; see my colleague Roland Hwang’s blog about how fuel efficiency is powering job growth today.)
NRDC calculated the state-level annual reductions in fuel consumption, expenditures and pollution from the 2017-2025 standards in 2030. We updated our previous analysis (“Relieving Pain at the Pump,” April 2012) with the latest projections of vehicle mileage and fuel prices in the Energy Information Administration’s Annual Energy Outlook 2012. The fuel savings map shows net savings to all consumers in each state, meaning it includes both the avoided fuel expenditures and the incremental vehicle cost of new fuel-saving technologies.
(Click on maps to open full-size in browser window.)
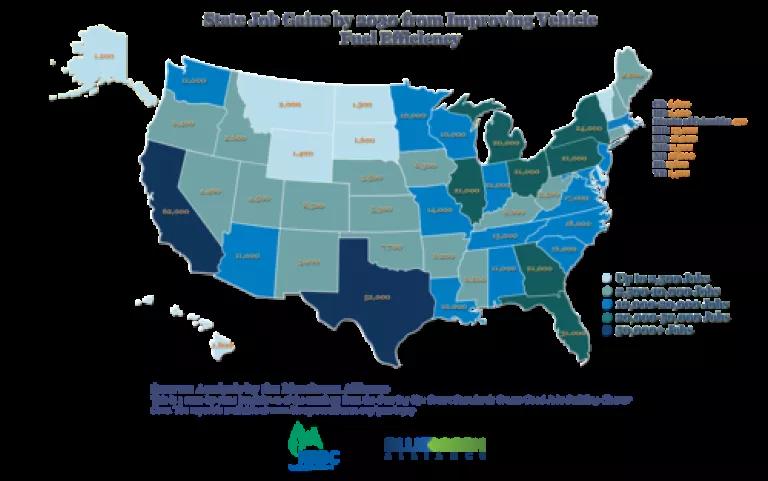
Jobs Created and Annual Consumer Savings of Model Year 2017 to 2025 Standards in 2030
|
State |
Jobs Created by 2030 |
Fuel Savings (million gallons) |
Fuel Savings ($ millions) |
Net Savings = Fuel Savings Minus Incremental Cost of Fuel-saving Technologies ($ millions) |
Carbon Pollution Reduction (Thousands of metric tons of CO2-equivalent) |
|
Alabama |
11,000 |
380 |
$1,615 |
$1,010 |
4,510 |
|
Alaska |
1,200 |
45 |
$200 |
$105 |
555 |
|
Arizona |
11,000 |
685 |
$2,920 |
$1,730 |
8,055 |
|
Arkansas |
6,200 |
255 |
$1,055 |
$665 |
3,015 |
|
California |
62,000 |
2,435 |
$10,405 |
$5,470 |
28,610 |
|
Colorado |
8,500 |
385 |
$1,640 |
$935 |
4,530 |
|
Connecticut |
6,600 |
235 |
$1,025 |
$580 |
2,760 |
|
Delaware |
1,400 |
70 |
$295 |
$175 |
830 |
|
District of Columbia |
470 |
30 |
$145 |
$85 |
405 |
|
Florida |
31,000 |
2,095 |
$8,795 |
$5,345 |
24,585 |
|
Georgia |
21,000 |
810 |
$3,410 |
$2,045 |
9,535 |
|
Hawaii |
1,800 |
75 |
$320 |
$165 |
885 |
|
Idaho |
2,600 |
120 |
$525 |
$305 |
1,450 |
|
Illinois |
21,000 |
700 |
$2,945 |
$1,395 |
8,210 |
|
Indiana |
12,000 |
365 |
$1,550 |
$740 |
4,325 |
|
Iowa |
6,300 |
185 |
$790 |
$415 |
2,210 |
|
Kansas |
5,300 |
180 |
$775 |
$420 |
2,160 |
|
Kentucky |
9,900 |
360 |
$1,520 |
$960 |
4,250 |
|
Louisiana |
10,000 |
360 |
$1,485 |
$925 |
4,250 |
|
Maine |
2,800 |
95 |
$415 |
$235 |
1,120 |
|
Maryland |
13,000 |
480 |
$2,030 |
$1,220 |
5,675 |
|
Massachusetts |
12,000 |
450 |
$1,960 |
$1,115 |
5,280 |
|
Michigan |
20,000 |
570 |
$2,415 |
$1,145 |
6,730 |
|
Minnesota |
10,000 |
395 |
$1,660 |
$905 |
4,630 |
|
Mississippi |
6,800 |
225 |
$965 |
$615 |
2,695 |
|
Missouri |
14,000 |
410 |
$1,725 |
$940 |
4,810 |
|
Montana |
2,000 |
70 |
$305 |
$170 |
840 |
|
Nebraska |
3,500 |
115 |
$485 |
$260 |
1,350 |
|
Nevada |
4,400 |
275 |
$1,185 |
$705 |
3,265 |
|
New Hampshire |
2,900 |
105 |
$455 |
$265 |
1,235 |
|
New Jersey |
18,000 |
520 |
$2,220 |
$1,120 |
6,100 |
|
New Mexico |
3,900 |
135 |
$575 |
$330 |
1,585 |
|
New York |
24,000 |
1,055 |
$4,505 |
$2,285 |
12,380 |
|
North Carolina |
18,000 |
875 |
$3,675 |
$2,235 |
10,280 |
|
North Dakota |
1,500 |
35 |
$165 |
$85 |
460 |
|
Ohio |
21,000 |
635 |
$2,685 |
$1,245 |
7,475 |
|
Oklahoma |
7,700 |
310 |
$1,270 |
$795 |
3,635 |
|
Oregon |
6,400 |
290 |
$1,240 |
$665 |
3,415 |
|
Pennsylvania |
21,000 |
720 |
$3,085 |
$1,540 |
8,485 |
|
Rhode Island |
1,600 |
70 |
$325 |
$185 |
875 |
|
South Carolina |
12,000 |
360 |
$1,520 |
$910 |
4,250 |
|
South Dakota |
1,600 |
50 |
$210 |
$110 |
585 |
|
Tennessee |
13,000 |
585 |
$2,460 |
$1,565 |
6,865 |
|
Texas |
52,000 |
2,405 |
$9,865 |
$6,260 |
28,215 |
|
Utah |
4,500 |
185 |
$805 |
$460 |
2,220 |
|
Vermont |
1,400 |
45 |
$200 |
$115 |
550 |
|
Virginia |
17,000 |
690 |
$2,895 |
$1,735 |
8,095 |
|
Washington |
11,000 |
510 |
$2,190 |
$1,165 |
6,025 |
|
West Virginia |
3,500 |
125 |
$540 |
$320 |
1,510 |
|
Wisconsin |
10,000 |
335 |
$1,415 |
$670 |
3,950 |
|
Wyoming |
1,400 |
35 |
$150 |
$80 |
415 |
|
U.S. Aggregate |
570,000 |
22,930 |
$97,010 |
$54,920 |
270,130 |