

This is part of a series of NRDC posts around the 1-year anniversary of Superstorm Sandy and a list of our top ten Post-Sandy recommendations.
_______
When Hurricane Sandy came ashore nearly one year ago, it exposed some of the problems that the country has with the way it manages the risk of flooding. And these problems will magnify due to climate change, as sea levels rise and storms intensify, making floods more likely along the nation's rivers and coastlines.
The Federal Emergency Management Agency (FEMA) oversees the National Flood Insurance Program (NFIP). As a nation our track record has not been very good at managing the risk of flooding, which explains why the NFIP will be between $25 billion and $30 billion in debt once all claims from Sandy are paid out.
Two things have been major impediments:
- FEMA has struggled to keep flood maps up-to-date, underestimating how wide an area is susceptible to flooding and leaving people with a false sense of security.
- Too many property owners have purchased flood insurance and received generous federal subsidized prices, basically getting an incentive to live in flood prone areas — and in harm’s way.
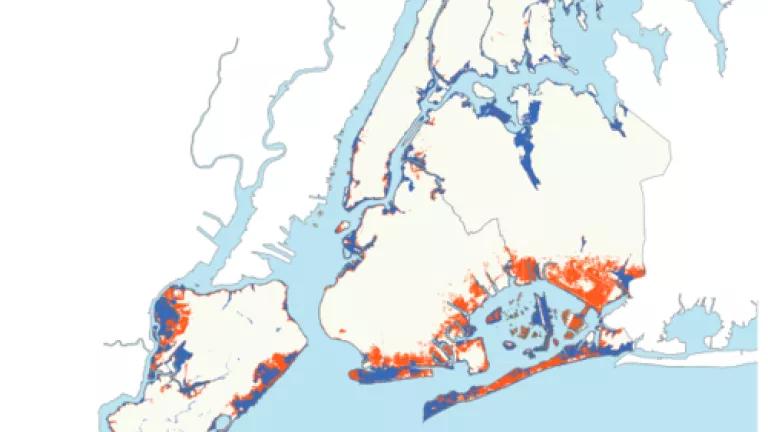
Hurricane Sandy illustrated why we need to fix these problems, and quickly. The area that was actually flooded by the storm surge far exceeded the area FEMA’s maps showed to be at risk of flooding (see below). Property owners need to understand that they live in an area that could flood and flood frequently, but out-of-date maps don’t tell them what they need to know.
How can you even protect yourself or prepare for the risks if you don’t know that you live in a flood zone?
Arming people with this knowledge is more important than ever. Using the New York and New Jersey area as an example, we know that Sandy-like flooding is no longer considered a once-in-a-lifetime event. In September of this year, the National Oceanic and Atmospheric Administration published a report that found a similar level of flooding could occur in Lower Manhattan and Sandy Hook in New Jersey every 20-50 years -- and that assumes we make deep cuts in climate pollution. If emissions do not come down sharply, we will likely see much higher levels of sea level rise (upwards of 6 feet) and Sandy-like flooding could happen every year or two. If flooding is going to happen more frequently, it's critical for property owners and local officials to know where to expect it and guide develpment out of harm's way.
Compounding the problem of maps that do not reflect the true risk of flooding are flood insurance prices that also do not reflect the true risk of flooding. For too long, federal subsidies for flood insurance have encouraged people to continue living in harm’s way. In the counties of New York and New Jersey most heavily impacted by Sandy, 34% of flood insurance policy holders received subsidized rates. Around Atlantic City, New Jersey 44% of policies received taxpayer subsidies (see below for a county-by-county breakdown). These subsidies no only encourage people to live in flood prone areas, but also leave taxpayers holding the bag when flood damages occur.
A higher proportion of people were getting subsidized flood insurance in these vulnerable coastal areas than in other parts of New York and New Jersey. For New Jersey 20.6% of all NFIP policies are subsidized and in New York 25.9% are subsidized. Nationwide, about 20% of all policies are subsidized. We can no longer afford provide incentivies to live in low-lying areas that are vulnerable to flooding.
As the climate warms, the risk of flooding increases and the problems caused by out-of-date maps and subsidies for insurance will increase as well. According to a study conducted by FEMA, climate change will result in a 45% increase in the extent of areas at risk of flooding along rivers and 60%-130% increase in coastal areas.
But things are starting to change. FEMA is updating flood risk maps around the country and they're showing that more people are at greater risk from floods.
In the wake of Sandy, new advisory flood maps were put together for New York and New Jersey. These new maps show a very different picture of the areas susceptible to flooding due to high water and wind driven waves. In New York City, the old maps showed 35,500 buildings in the floodplain. The updated maps show a more extensive floodplain that holds 67,700 buildings. New flood maps are being rolled out in other parts of the country as well that show a similar expansion of areas vulnerable to flooding.
And subsidies are also being phased out, thanks to reforms passed in Congress in 2012. Under the Biggert-Waters Flood Insurance Reform Act of 2012, subsidies will be phased out for properties that are second homes, businesses, or have been heavily damaged by flooding in the past.
These are positive developments and will go a long way towards decreasing the future risk of flooding. But more needs to be done, especially when one factors in climate change.
The new maps, which use the latest data on elevation, precipitation patterns, and hydrology, still fail to account for sea level rise and other climate-induced flooding risks. This is a shortcoming that has to be fixed. In New York and New Jersey, scientists know that sea levels have already risen about one foot over the last century and are predicting that sea levels could rise one or two more feet in New York and New Jersey by the year 2050.
These are no longer theoretical problems to be solved at some date in the future. Hurricane Sandy showed us what these risks look like and what the future has in store for us.
---------------
Some of the counties in New York and New Jersey that sustained the most damage from Hurricane Sandy have the highest percentage of subsidized flood insurance policies. Overall, 20.6% of all NFIP policies are subsidized in New Jersey and 25.9% in New York.
|
New York Counties |
Subsidized Policies |
Total Policies |
% Subsidized |
|
Suffolk |
10,594 |
37,667 |
28% |
|
Nassau |
15,520 |
45,249 |
34% |
|
Queens |
4,458 |
14,705 |
30% |
|
King (Brooklyn) |
2,694 |
10,699 |
25% |
|
New York (Manhattan) |
1,954 |
5,667 |
34% |
|
Richmond (Staten Island) |
1,985 |
6,427 |
31% |
|
|
|
|
|
|
New Jersey Counties |
Subsidized Policies |
Total Policies |
% Subsidized |
|
Hudson |
5,460 |
19,877 |
27% |
|
Union |
2,503 |
5,892 |
42% |
|
Monmouth |
6,691 |
21,136 |
32% |
|
Ocean |
20,071 |
52,824 |
38% |
|
Atlantic |
13,557 |
31,013 |
44% |
|
Totals for New York and New Jersey |
85,487 |
251,156 |
34% |