New Analysis: California Is Already Cutting Carbon Pollution and Reducing Vehicle Fuel Expenditures

This week’s release of the U.S. National Climate Assessment sends a stark message confirming that climate change is here and we need to act now. The Pacific Coast states of California, Washington, and Oregon are already taking major steps to cut carbon pollution in key sectors, such as energy efficiency and advanced transportation. And California is certainly proving that cutting carbon pollution, transitioning to cleaner energy sources, and creating a robust and growing economy actually go hand-in-hand.
If you’re like the vast majority of Californians, you already favor our state’s clean energy and climate law, AB32, and the goal of reducing emissions back to 1990 levels by 2020. Not as well-known to the public is that California is almost halfway through implementation and well on-track to reduce emissions below the state’s 2020 target and then some.
And the doomsday scenarios from the oil industry and the opponents to AB32 have not panned out. In fact, California is also saving some serious money at the pump while cutting carbon pollution from our cars, trucks, and fuels according to NRDC’s analysis.
AB32: Reducing Petroleum Use and Fuel Expenditures
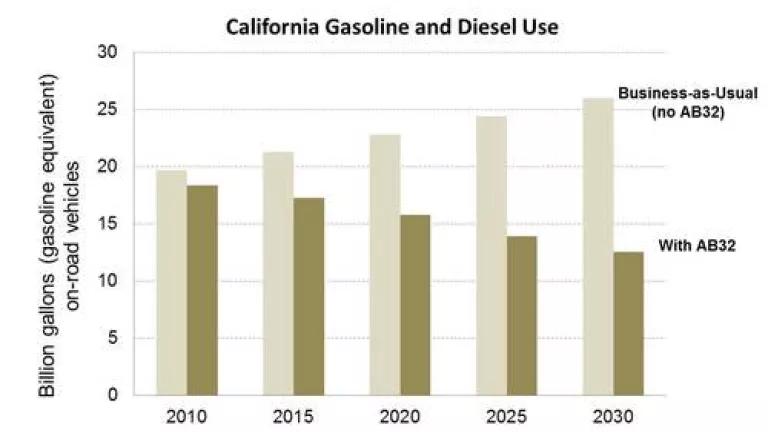
Our analysis of AB32 demonstrates that by 2020 -- just six years away -- gasoline and diesel use will decrease by just over 30% compared to what it would have been without AB32 transportation measures, or business-as-usual. Some of these measures include requirements that are leading to more efficient cars and trucks, cleaner alternative fuels, and more transit-friendly and walkable communities. Other independent analyses, including publications by researchers from Lawrence Berkeley National Labs and other institutes , Bloomberg New Energy Finance, and the California Air Resources Board show similar downward trends in fuel use due to these measures.
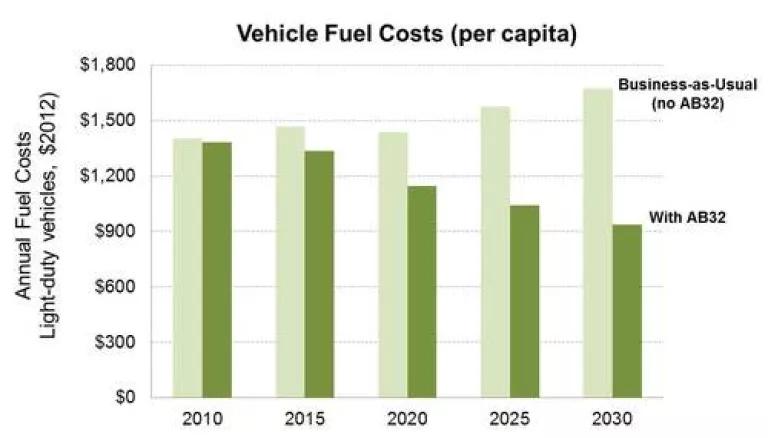
In terms of how much Californians are spending to buy fuel for their cars and trucks, we estimate AB32 transportation measures will reduce per capita costs by 20% by 2020, or nearly $300 saved annually per person on fuel, compared to what it would have been without AB32. These savings grow even bigger as the measures are fully implemented, even with the regulatory compliance costs for the oil industry included.
Here are some examples of how the state’s carbon-diet is reducing vehicle fuel expenditures.
Saving money at the pump through more efficient cars and trucks. As a result of California’s Clean Car Standards – now adopted federally – vehicles are going farther than ever on a gallon of fuel. Compared to 2008, when automakers only offered 12 car models that could achieve 30 miles per gallon or more, last year over 70 such models were offered to consumers, according to the U.S. EPA.
Reducing the need to drive with more walkable, transit-friendly communities. Through California’s sustainability communities’ strategy (SB375), each metropolitan region is implementing plans to make communities easier to walk, bike and take public transportation.
Introducing cleaner fuels into the market, resulting in increased competition and fuel supply. Through California’s Low Carbon Fuel Standard, the amount of cleaner alternative fuels will grow significantly over the next five years. A study released last month by Mills College economists Jasmin Ansar and Roger Sparks, commissioned by NRDC, found $837 million in benefits in 2020 as a result of the program increasing energy diversification and market competition.
Why Is The Oil Industry Claiming Consumer Fuel Costs Will Go Up?
It’s no surprise that the oil industry and their lobby remain opposed to current AB32 policies. But rather than invest to become the clean energy providers of tomorrow and help solve the climate change problem, the oil industry lobby remains focused on telling the public and policymakers the opposite: that AB32 is increasing fuel costs for Californians.
This myth is based on analysis that ignores the fuel savings resulting from AB32 measures and that focuses only on their own industry’s compliance costs.
While nobody is arguing that reducing carbon emissions will have compliance costs for the oil industry (versus just freely polluting), the fact is AB32 is also providing tremendous value for Californians in the form of vehicle efficiency, cleaner alternative fuels, and more walkable and transit-friendly development. All of these provide big savings for Californians in terms of their fuel expenditures.
What’s more, state law requires that proceeds from pollution fees collected from the oil industry be reinvested back into California, benefiting the public in the form of more efficient cars, trucks, and increased transit options.
Large Fuel Savings are Only One Part of the Story
But even outside reduced fuel expenditures, there are other significant benefits for all Californians from AB32 including:
- Reduced health costs and avoided premature deaths and illness. California’s climate policies will yield significant co-benefits in terms of reduced smog-forming emissions and particulate matter. With nearly twice as many Californians dying annually from traffic pollution compared to motor-related accidents each year, these critical co-benefits must not be forgotten.
- Carbon pollution reductions: We estimate 70 million metric tons will be reduced in 2020 alone due to California’s transportation measures. That's equivalent to the annual emissions of nearly 15 million passenger vehicles.
- Improved energy security: Reductions in oil-dependence due to AB32 yields significant benefits valued at potentially billions of dollars annually, based on energy security estimates by Oak Ridge National Laboratory.
This week’s release of the National Climate Assessment shows we need to rapidly put the brakes on carbon pollution. Once again, California is showing that we can cut our carbon pollution, transition to cleaner vehicles and fuels, all while reducing our fuel expenditures.
----------------------------------------------------------
* For further details on the analysis used for the figures, see Technical Notes.pdf.
Related Blogs

Californians Deserve to Breathe Easy – Transportation Must Do Its Part
An Opportunity to Reconnect Communities in CA