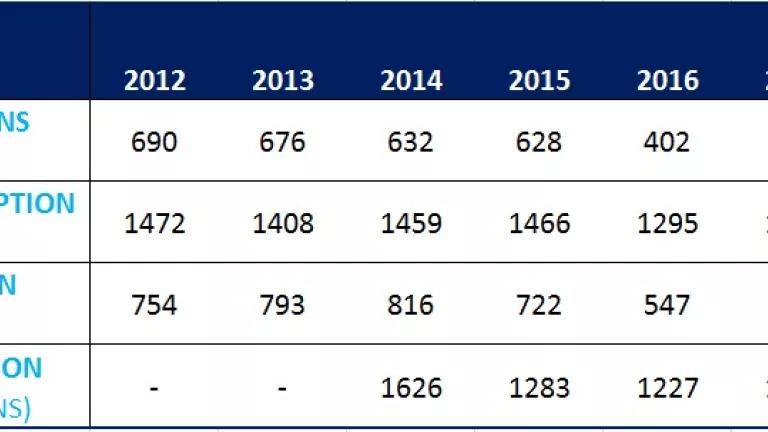
This spreadsheet compares existing emissions in states, and allows you to compare that to other states and various targets.
This is not intended to recommend CO2 emissions outcomes or be a forecasting tool, but to consider emissions standards in relation to historic emissions trends, and depending on how EPA structures a carbon standard under Sec. 111(d), examine how a standard might compare across states and over time.
It's organized as a series of spreadsheet tabs. Below is a quick summary of what you can do with each tab:
Summary Graphics
- Choose a set of states
- Compare CO2 emissions; emissions rates in terms of fossil-intensity and total-intensity; and sources of generation
- Note: this tool is based on EIA fuel use, so it is an estimate of all electric sector emissions
Fossil Intensity Standard
- Choose a set of states to compare
- Choose a set of baseline years
- Input an intensity standard based on a coal and other fossil target (NRDC proposal)
- Input an intensity standard based on a percent reduction
Total Intensity Standard
- Choose a set of states to compare
- Choose a set of baseline years
- Input a total intensity standard (emissions / total generation, including non-emitting) based on a linear path from the baseline to a common end point in 2050
- Input a total intensity standard based on a percent reduction
Mass Based Standard
- Choose a set of states to compare
- Choose a set of baseline years
- Input mass based standard based on a percent reduction
Historic Emissions and MWh
- Allows you to examine the state data the other tabs are built on
- Select a state at the top
Notes
- Describes the data sources and assumptions


