Feast and Famine: Time for a Reality Check on California's Quest for a Reliable Delta Water Supply
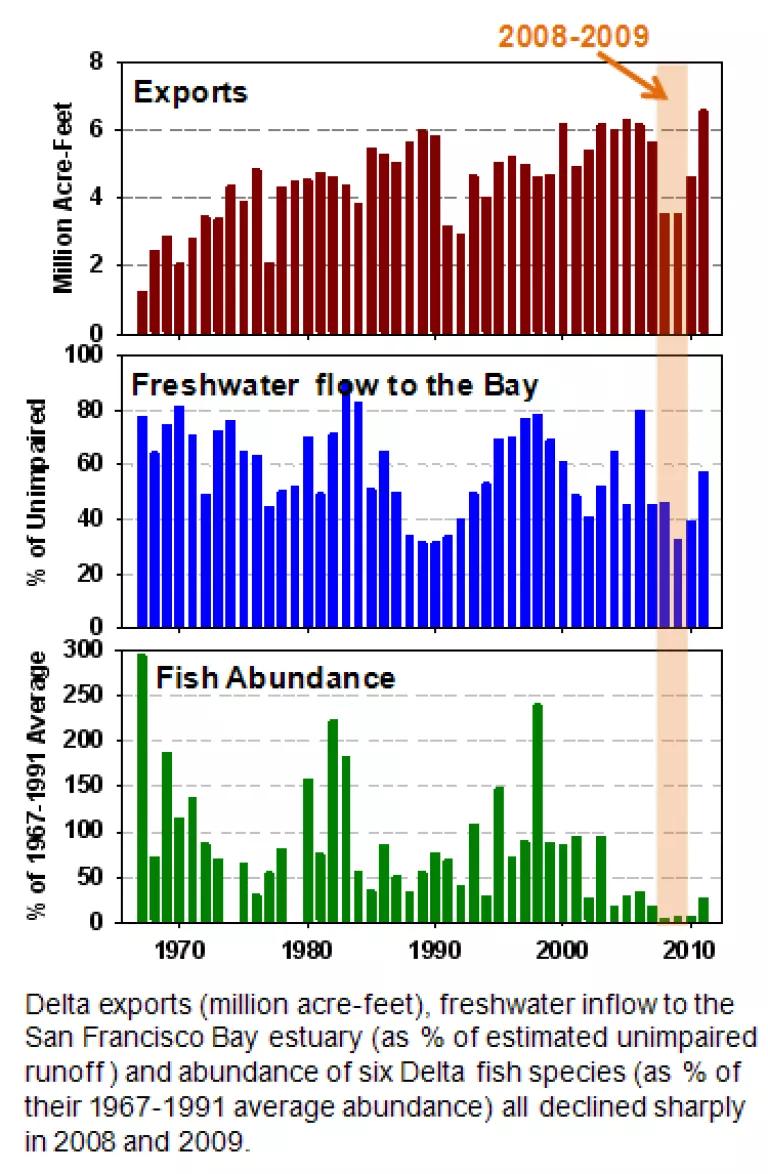
In 2008 and 2009, supplies of water exported from California’s Sacramento-San Joaquin Delta plummeted 37%, from a record high ten-year average of 5.6 million acre-feet per year during the previous decade to just 3.5 million acre-feet.[1] Since Delta exports provide some or all of the water used by 25 million Californians and irrigate millions of acres of San Joaquin Valley farmland, this was a big deal—and a rude awakening for urban and agricultural water users who depend on this water.
During those same years, freshwater flows into San Francisco Bay were reduced by 54% in 2008 to a near record 68% in 2009, culminating a decade in which the estuary experienced seven years of man-made drought conditions.[2] Populations of several Delta fish species fell to record lows,[3] continuing the catastrophic ecosystem decline of the 2000s now referred to as the Pelagic Organism Decline. Since some of these fishes were already endangered and known to be harmed by habitat degradation from reduced freshwater flows to the estuary, this was a big deal—and no surprise to scientists and fisheries managers charged with protecting the Bay-Delta ecosystem.
Some urban and agriculture water users blamed the drop in water supply on new rules to protect endangered fish species from the export pumps, but analysis by the California Department of Water Resources showed that less than 25% of the reduction was attributable to fish protections. Since managing the Delta to provide a “reliable water supply” was one of the two co-equal goals mandated for Delta management by the state legislature this same year (2009),[4] you would think that this large and abrupt drop in exports—and what it could tell us about Delta water supply reliability—would have been rigorously investigated and the results incorporated into the ongoing planning efforts.
However, if the recently proposed plans and the extensive planning discussions upon which they supposedly were based are any indication, this does not seem to have been the case. Beyond expressed desires for increased exports and plans for new water intake facilities and massive tunnels to convey water under the Delta to the existing export pumps, neither the “old” Bay Delta Conservation Plan (and see my earlier posts here and here) nor the “new” one announced by California’s governor in July have included any meaningful or useful discussion of what the water supply reliability goal even means.
What is a reliable water supply? How do you define it? What are the factors that affect it? How much water is it? And how do you figure that out?
Nearly a decade ago, California’s CALFED Bay-Delta Program tackled the water supply reliability issue, defining reliability as a “measure of a system’s ability to provide uninterrupted service.” CALFED never successfully addressed the last two questions above, but it did have a pretty clear understanding of the factors that could affect reliability, including “structural inadequacies” in water storage and conveyance facilities (i.e., the plumbing), “natural causes” like year-to-year variations in precipitation and runoff (aka Mother Nature), and “demands above [the system’s] capacity” (basically us wanting more water than the system can provide).
Earlier this year, I wrote about how applying our scientific understanding of how a system works using a logical sequence of steps can be used to develop plans to solve problems. Although the recent Delta planning efforts seem to have ignored it, I think CALFED’s work offers a good conceptual foundation for using this approach to identify key elements of a plan to provide a reliable water supply from the Delta. In tomorrow’s post, I’ll give it a try.
But today, before I sign off, let me pose a couple of questions for consideration by those of us interested in—or affected by—Delta water management. Should we describe a reliable water supply as the percentage of years that the Delta pumps can export specific amounts of water, for example, using an exceedance curve (see Figures 8 and 10 in this paper for examples)? Or should we describe it as the specific amount of water that the Delta pumps can reliably export, year in and year out? If you were a farmer needing to know how much water you will get to irrigate your crops, or a city manager needing to know how much water you can expect to keep the taps running, what would you rather know: “how likely?” or “how much?”
[1] Data source: California Department of Water Resources Dayflow. The top panel of the graph shows combined annual Delta exports of the Central Valley Project and State Water Project.
[2] Data sources: California Department of Water Resources Dayflow and California Central Valley Unimpaired Flow Data. The middle panel of the graph shows the percentage of estimated unimpaired runoff from the San Francisco Bay’s Sacramento-San Joaquin watershed that actually flowed into the estuary.
[3] Data source: California Department of Fish and Game Fall Midwater Trawl Survey. The bottom panel of the graph shows combined (average) abundance of delta smelt, longfin smelt, splittail, striped bass, American shad and threadfin shad, expressed as percentage of their 1967-1991 average abundances.
[4] The other co-equal goal is to protect, restore and enhance the Delta ecosystem.
Related Blogs
Kern County’s Self Imposed Deja-vu
New Analysis Shows Widespread PFAS Contamination of Tap Water in CA