

This post written with Dan Lashof
In Olympic diving, the judges score each dive based on a mutually-agreed "degree of difficulty." So too in evaluating proposed carbon emission reduction targets for 2020, the judges - in this case the members of the House Energy and Commerce Committee - need to be using the same scoring system. They need to have the same information on how big a lift various targets may be. It turns out that judged against the appropriate benchmark the Waxman-Markey target is less of a lift than less stringent targets appeared to be when they were adopted two years ago.
Right now members of the Energy and Commerce committee are weighing a range of targets for 2020: Reps. Waxman and Markey have proposed reducing emissions 20 percent below 2005 levels. Others have voiced support for a 14 percent reduction (equivalent to President Obama's proposal to return to 1990 levels by 2020). And some committee members are reported to be advocating even smaller reductions.
It is not clear, however, that all of the committee members are using the same information on "degree of difficulty." The members may not all be aware of recent changes in the government's business-as-usual emissions forecast - leading some members to think that a given reduction target is much more challenging than others do. It's as though some Olympic diving judges think the board is three meters above the water, while others think it is six.
The Energy Information Administration produces a baseline emissions forecast each year - the "Annual Energy Outlook" - with projections of emissions through 2020 and beyond based on forecasts of economic growth, the price and mix of fuels, trends in the introduction of new energy production and use technologies, and the effect of already adopted energy and environmental policies. This baseline forecast determines how much additional emissions reduction is needed to meet any given carbon target.
Here's the key point: with each successive Annual Energy Outlook, the Energy Information Administration has been lowering its baseline forecast. Projected 2020 emissions were lower in AEO 2008 than AEO 2007, and they are lower still in AEO 2009, and the most recent forecast, AEO 2009 with ARRA, which is a revised forecast accounting for the clean energy investments in the stimulus bill.
So if you judge a target's degree of difficulty on the basis of AEO 2007, it looks a lot harder to achieve than on the basis of AEO 2009.
When then-candidate Obama first articulated his carbon emissions target, equivalent to a 14 percent reduction from 2005 levels, the most recent baseline forecast was AEO 2007. The Waxman-Markey target, 20 percent below 2005 levels, is based on AEO 2009.
When you compare these two targets with their contemporary baselines, you can see how much emissions reduction was thought to be needed to meet each target - the target's "degree of difficulty." In short, judged against the contemporary baseline, the Waxman-Markey target is less of a lift than the Obama target was thought to be at the time Senator Obama endorsed it.
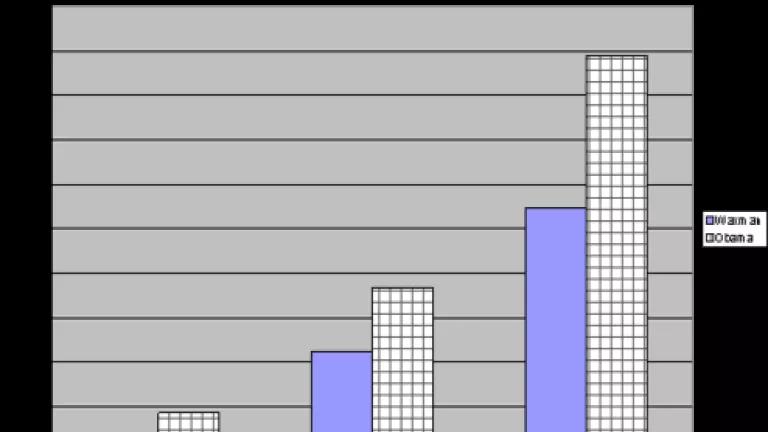
This is illustrated in the figure below, which compares the two 2020 targets against their contemporary baselines. (The same comparisons are given for 2012 and 2030 as well.)
Source: The reference case for the Waxman-Markey targets is the revised Energy Information Administration Annual Energy Outlook 2009, including the effects of the American Recovery and Reinvestment Act, released April 2009. The reference case for the Obama targets is the 2007 Annual Energy Outlook. Energy-related carbon dioxide emissions are used as a proxy for emissions covered by the targets. The Waxman-Markey targets are 97% of 2005 levels in 2012, 80% of 2005 levels in 2030 and 58% of 2005 levels in 2030. The Obama targets are taken as 100% of 2005 levels in 2012, 86% of 2005 levels in 2020 and 58% of 2005 levels in 2030.
What does this mean for the Energy and Commerce negotiations?
- First, that the members need to be judging the difficulty of proposed targets against the AEO 2009 baseline, not older, out-of-date forecasts.
- Second, that when you use AEO 2009, you can see that the 20 percent reduction target Waxman and Markey have proposed is less of a lift than targets that might have seemed ambitious a year ago.