***NOTE*** The map and table below are based on the average fuel economy standard from 2011. NRDC has created two new maps and a table using data reflecting on-road conditions which is also worth a look. Click here to see them. Thanks! - Deron
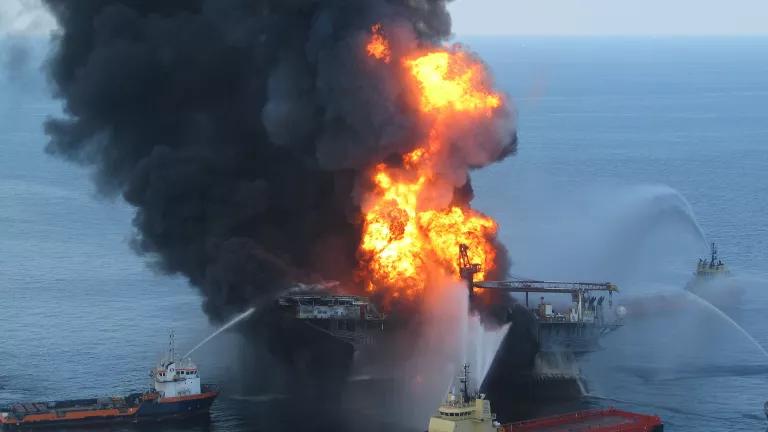
Overdependence on oil, especially in transportation, remains a threat to America in spite of increasing vehicle fuel-efficiency and domestic production. As a country, we spend a huge amount of money on gasoline, with much of that money leaving the country. And swinging oil prices exacerbate the pain we feel at the pump. It seems every year there’s oil price volatility. When people drive to work and oil prices unexpectedly shoot up, they can then feel trapped between the need to commute and run errands in the face of high oil prices.
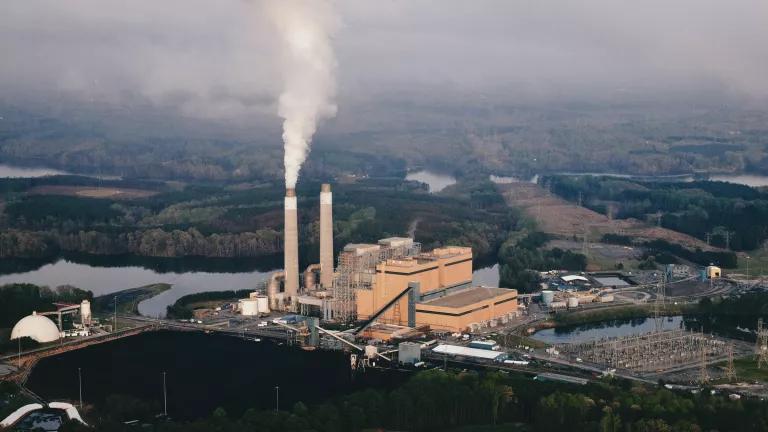
America buys 18.8 million barrels of petroleum products every day, accounting for more than 20% of all global usage. This can drain roughly $1 billion on average every day out of the economy. This oil use also accounts for more than a quarter of the heat-trapping carbon pollution emitted by various sources in the U.S.
The Natural Resources Defense Council, Sierra Club and League of Conservation Voters developed an interest in a more detailed understanding for the causes of our addiction. Specifically, we were curious about which geographic areas were most oil dependent, and thus, driving the country's oil addiction the most.
First, we looked at all the total 2010 oil consumption in every county in the United States. We visualized that oil consumption in the map below.
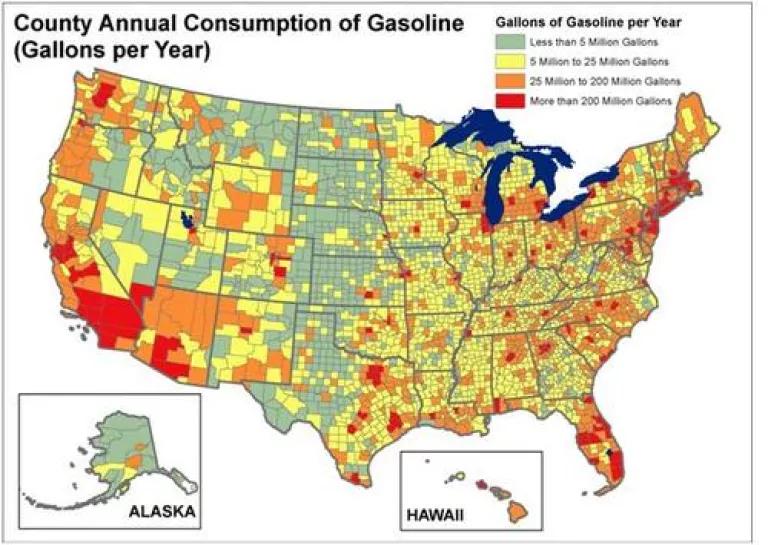
We can determine the nation’s oil addiction “hot spots” based on the figures plotted in the map above. It turns out a disproportionately small number of counties in metropolitan regions drive the nation's oil use. In fact, just 108 counties out of the nation's 3,144, or about 3.5% of the total consume more than 10% of the nation's oil. This suggests that we should target policies and practices aimed at reducing oil dependence to a small geographic portion of the nation.
Consumption per person in these top oil-guzzling counties can give help further with targeting; those counties with high per-capita consumption levels afford the biggest opportunities for reductions. For example, Los Angeles County’s population is much larger than Dallas County’s, on average each person consumed much less in the former. If the per capita consumption in the latter were halved, while still higher than the average Los Angeleno it could save more than a half-million gallons of gasoline a year!
Top 10 Counties Driving Our Oil Addiction
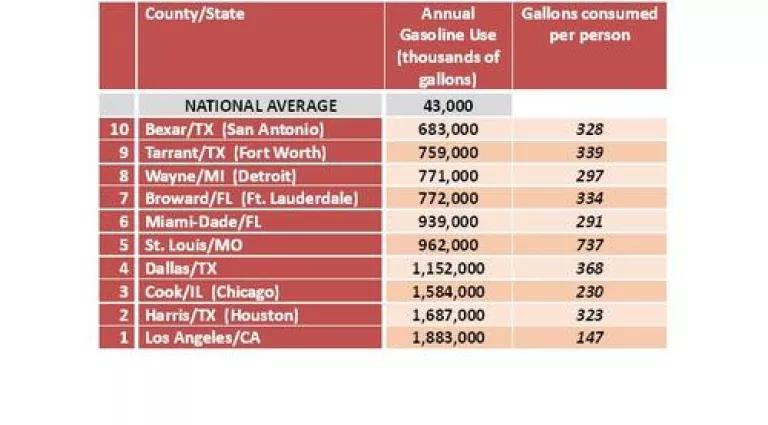
*Note: The Missouri figures stood out as an outlier in the data set, possibly due to poor or inconsistent reporting so both on the map and in this table the numbers should be taken with a giant grain of salt.
On the other hand the Houston area and Dallas area are particularly addicted to oil, both in total and per person use. To find out more about where your county stacks up in this picture, click here to access and use a cool googlemap designed by friends at the Sierra Club.
So what do we do with this information, other than generally targeting advocacy and education for reduced oil use to those counties that stand out as hot spots in absolute and per-capita terms?
- We must improve access to existing transit systems. We can make existing transportation systems more effective and fair. Unfortunately, in the US, having a transit system and having access to that system are not the same. The Brookings Institution studies most populated metropolitan regions in the country; 30% of people in counties making up such regions or nearly 60 million people can’t access their public transportation systems. It is too far, inconvenient or impossible for them to make transit a viable option. For example, a transit stop may be designed without adequate pedestrian or bikeable or walkable access due to dangerous road crossings or a lack of sidewalks. In the Midwest and Southern regions of the US, this percentage is worse, at 36% and 45% respectively. Lacking access to transit also has a financial impact. Those without access spent, on average, 28% more on transportation than those with transit access. This is roughly $500 per year. If elevated and volatile oil prices continue to be the norm, lack of options can be a serious burden.
- Increase the transportation choices people have. Particularly with the rapid fluctuations in oil prices, people increasingly need transportation choices to avoid being trapped in driving even if prices rise. A recent NRDC-commissioned national poll shows how badly we are falling short of delivering transportation choices to consumers. 58 % would like to use public transportation more often, but it is not convenient or available from their home or work, and only one-third would give availability of public transportation an A or B grade. We can, and must, do better.
- Upgrade fuel efficiency for drivers. Cars that require less oil to go the same distance will both lessen the burden of oil on American wallets as well as reduce the risk of rapid price changes. And I can end on a high note with this recommendation. The Obama Administration took the biggest single step towards vehicle fuel-efficiency in U.S. history this year. It set a fuel-economy and carbon pollution bar from our car and truck fleet of 54.5 miles-per-gallon for new vehicles by 2025. Thanks to this leap forward in vehicle technology in just a couple of decades we will be saving millions of barrel daily, cutting heat-trapping pollution by hundreds of millions of tons and keeping thousands of dollars each of would instead have poured into gasoline pumps.
The simple truth is that more fuel-efficiency and more public transportation can help us break our oil addiction for good. Let’s get to work.
Related Blogs
Power Plant Carbon Rules: What’s Changed Since the 2023 Proposal?
Hidden Fossil Fuels: Plastic Production Drives Climate Change