This fall, when Superstorm Sandy hit New York City, where I live, I was in San Francisco, at the 2012 annual meeting of the American Public Health Association. Watching it all unfold on the news—- the flooding, the fires, the houses pulled into the sea—- was profoundly dislocating and disquieting, even at a conference where more than 100 sessions, talks, or posters were devoted to climate change’s impact on our nation’s health.
At the conference, I watched colleagues point to their flooded, powerless hospitals on TV screens, saying, numbly, “That’s where I work.” Or hunched in corners of the San Francisco conference center, calling east to make sure that family and friends, coworkers and patients were safe. Others had to abandon their panels and sessions altogether, trying to get flights home to coordinate emergency response.
That was one of the many ways climate change touched me in 2012. No doubt, it affected you, too, whether you wilted in the unbearable, record-breaking heat like an Iowa cornstalk, or lived through any of the 11 “natural” disasters in 2012 that have so far cost the nation at least $1 billion each. (One estimate of Sandy’s cost is a mind-throttling $79 billion.)
NRDC keeps those impacts in mind today, as we launch our second annual, interactive extreme weather map. It documents, both by month and by state, some of 2012’s extreme weather events, including record-breaking temperatures. (To put this in perspective, 2012's temperatures beat the 20th century average by a startling 3.2 degrees Fahrenheit, according to the State of the Climate report released last week by the National Oceanographic and Atmospheric Administration.)
This map is an effort to help local, state and federal officials understand and prepare for the even more dangerous weather extremes that climate change may have in store. And it is an urgent call for every sector of American society — government, business, all of us — to help put the brakes on the even more dangerous future weather extremes that climate change may have in store, by cutting the fossil-fuel pollution that feeds global warming.
The map and the data behind it reveal much about the ways our climate is changing as a result of this heat-trapping pollution:
• In 2012, 3,527 new monthly weather records were set for heat, rainfall and snowfall. The previous year, 2011, saw 3,251 record-topping events.
• In 2012, the nation experienced its worst drought in 50 years, with 1,300 counties in 29 states declared drought disaster areas. Many of those droughts continue today.
• The storm surge in New York Harbor during Hurricane Sandy reached an all-time high: 13.88 feet.
• In December, international insurance giant Munich Re revealed that the US was home to more than 90 percent of the world’s insured 2012 weather-disaster costs.
In addition to cutting carbon pollution, we need to think about how best to prepare for climate change as it affects us day-to-day. Federal initiatives need to help state and local governments develop, prioritize, fund and implement climate-change plans that anticipate and limit the worst effects of these weather extremes. Governments could benefit by collaborations with non-profits, including faith-based organizations, colleges, senior centers and others, to plan and coordinate response and relief efforts that take local realities into account.
The Federal Emergency Management Agency (FEMA) can help states and local governments prepare for these challenges by providing written guidance, expert technical assistance and other resources. And FEMA needs to require that states include climate change’s effects in their Hazard Mitigation Plans. It doesn’t make sense to do otherwise, when climate change is fueling so many extreme weather events – and these hazards are costing us billions.
Climate change is global, but these events are local, and the toll they're taking is hitting home.
NRDC’s 2012 interactive extreme weather map will, we hope, enable you to take a local look at extreme weather where you live. We hope, too, it lends a sense of the cumulative picture of events over the whole year, and remind us how much we stand to gain, not lose, by making climate preparedness a real priority, and by taking action to limit sources of heat-trapping pollution.
Related Blogs
Power Plant Carbon Rules: What’s Changed Since the 2023 Proposal?
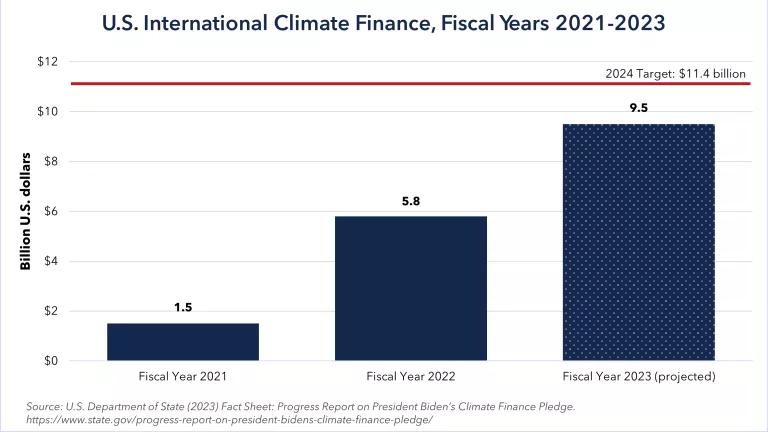
How the U.S. Can Still Meet its Global Climate Finance Pledges