Air Pollution: Everything You Need to Know
How smog, soot, greenhouse gases, and other top air pollutants are affecting the planet—and your health.
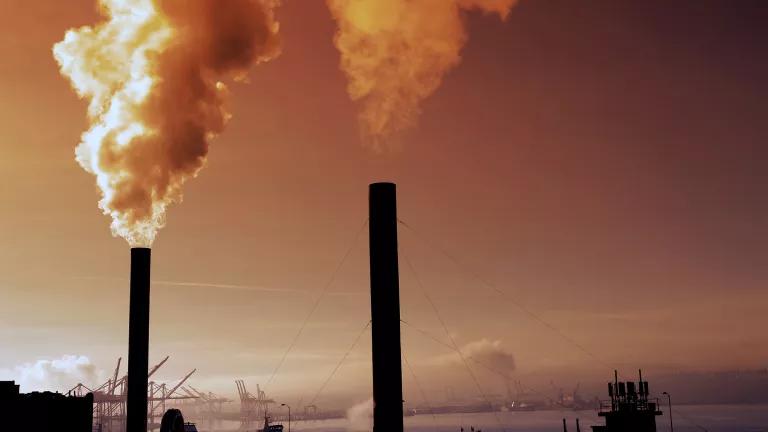
iStock
What is air pollution?
Air pollution refers to the release of pollutants into the air—pollutants that are detrimental to human health and the planet as a whole. According to the World Health Organization (WHO), each year, indoor and outdoor air pollution is responsible for nearly seven million deaths around the globe. Ninety-nine percent of human beings currently breathe air that exceeds the WHO’s guideline limits for pollutants, with those living in low- and middle-income countries suffering the most. In the United States, the Clean Air Act, established in 1970, authorizes the U.S. Environmental Protection Agency (EPA) to safeguard public health by regulating the emissions of these harmful air pollutants.
What causes air pollution?
“Most air pollution comes from energy use and production,” says John Walke, director of the Clean Air team at NRDC. Driving a car on gasoline, heating a home with oil, running a power plant on fracked gas: In each case, a fossil fuel is burned and harmful chemicals and gases are released into the air.
“We’ve made progress over the last 50 years in improving air quality in the United States, thanks to the Clean Air Act. But climate change will make it harder in the future to meet pollution standards, which are designed to protect health,” says Walke.
Effects of air pollution
Air pollution is now the world’s fourth-largest risk factor for early death. According to the 2020 State of Global Air report—which summarizes the latest scientific understanding of air pollution around the world—4.5 million deaths were linked to outdoor air pollution exposures in 2019, and another 2.2 million deaths were caused by indoor air pollution. The world’s most populous countries, China and India, continue to bear the highest burdens of disease.
“Despite improvements in reducing global average mortality rates from air pollution, this report also serves as a sobering reminder that the climate crisis threatens to worsen air pollution problems significantly,” explains Vijay Limaye, senior scientist in NRDC’s Science Office. Smog, for instance, is intensified by increased heat, forming when the weather is warmer and there’s more ultraviolet radiation. In addition, climate change increases the production of allergenic air pollutants, including mold (thanks to damp conditions caused by extreme weather and increased flooding) and pollen (due to a longer pollen season). “Climate change–fueled droughts and dry conditions are also setting the stage for dangerous wildfires,” adds Limaye. “Wildfire smoke can linger for days and pollute the air with particulate matter hundreds of miles downwind.”
The effects of air pollution on the human body vary, depending on the type of pollutant, the length and level of exposure, and other factors, including a person’s individual health risks and the cumulative impacts of multiple pollutants or stressors.
Smog and soot
These are the two most prevalent types of air pollution. Smog (sometimes referred to as ground-level ozone) occurs when emissions from combusting fossil fuels react with sunlight. Soot—a type of particulate matter—is made up of tiny particles of chemicals, soil, smoke, dust, or allergens that are carried in the air. The sources of smog and soot are similar. “Both come from cars and trucks, factories, power plants, incinerators, engines, generally anything that combusts fossil fuels such as coal, gasoline, or natural gas,” Walke says.
Smog can irritate the eyes and throat and also damage the lungs, especially those of children, senior citizens, and people who work or exercise outdoors. It’s even worse for people who have asthma or allergies; these extra pollutants can intensify their symptoms and trigger asthma attacks. The tiniest airborne particles in soot are especially dangerous because they can penetrate the lungs and bloodstream and worsen bronchitis, lead to heart attacks, and even hasten death. In 2020, a report from Harvard’s T.H. Chan School of Public Health showed that COVID-19 mortality rates were higher in areas with more particulate matter pollution than in areas with even slightly less, showing a correlation between the virus’s deadliness and long-term exposure to air pollution.
These findings also illuminate an important environmental justice issue. Because highways and polluting facilities have historically been sited in or next to low-income neighborhoods and communities of color, the negative effects of this pollution have been disproportionately experienced by the people who live in these communities.
Hazardous air pollutants
A number of air pollutants pose severe health risks and can sometimes be fatal, even in small amounts. Almost 200 of them are regulated by law; some of the most common are mercury, lead, dioxins, and benzene. “These are also most often emitted during gas or coal combustion, incineration, or—in the case of benzene—found in gasoline,” Walke says. Benzene, classified as a carcinogen by the EPA, can cause eye, skin, and lung irritation in the short term and blood disorders in the long term. Dioxins, more typically found in food but also present in small amounts in the air, is another carcinogen that can affect the liver in the short term and harm the immune, nervous, and endocrine systems, as well as reproductive functions. Mercury attacks the central nervous system. In large amounts, lead can damage children’s brains and kidneys, and even minimal exposure can affect children’s IQ and ability to learn.
Another category of toxic compounds, polycyclic aromatic hydrocarbons (PAHs), are by-products of traffic exhaust and wildfire smoke. In large amounts, they have been linked to eye and lung irritation, blood and liver issues, and even cancer. In one study, the children of mothers exposed to PAHs during pregnancy showed slower brain-processing speeds and more pronounced symptoms of ADHD.
Greenhouse gases
While these climate pollutants don’t have the direct or immediate impacts on the human body associated with other air pollutants, like smog or hazardous chemicals, they are still harmful to our health. By trapping the earth’s heat in the atmosphere, greenhouse gases lead to warmer temperatures, which in turn lead to the hallmarks of climate change: rising sea levels, more extreme weather, heat-related deaths, and the increased transmission of infectious diseases. In 2021, carbon dioxide accounted for roughly 79 percent of the country’s total greenhouse gas emissions, and methane made up more than 11 percent. “Carbon dioxide comes from combusting fossil fuels, and methane comes from natural and industrial sources, including large amounts that are released during oil and gas drilling,” Walke says. “We emit far larger amounts of carbon dioxide, but methane is significantly more potent, so it’s also very destructive.”
Another class of greenhouse gases, hydrofluorocarbons (HFCs), are thousands of times more powerful than carbon dioxide in their ability to trap heat. In October 2016, more than 140 countries signed the Kigali Agreement to reduce the use of these chemicals—which are found in air conditioners and refrigerators—and develop greener alternatives over time. (The United States officially signed onto the Kigali Agreement in 2022.)
Pollen and mold
Mold and allergens from trees, weeds, and grass are also carried in the air, are exacerbated by climate change, and can be hazardous to health. Though they aren’t regulated, they can be considered a form of air pollution. “When homes, schools, or businesses get water damage, mold can grow and produce allergenic airborne pollutants,” says Kim Knowlton, professor of environmental health sciences at Columbia University and a former NRDC scientist. “Mold exposure can precipitate asthma attacks or an allergic response, and some molds can even produce toxins that would be dangerous for anyone to inhale.”
Pollen allergies are worsening because of climate change. “Lab and field studies are showing that pollen-producing plants—especially ragweed—grow larger and produce more pollen when you increase the amount of carbon dioxide that they grow in,” Knowlton says. “Climate change also extends the pollen production season, and some studies are beginning to suggest that ragweed pollen itself might be becoming a more potent allergen.” If so, more people will suffer runny noses, fevers, itchy eyes, and other symptoms. “And for people with allergies and asthma, pollen peaks can precipitate asthma attacks, which are far more serious and can be life-threatening.”
Air pollution in the United States
More than one in three U.S. residents—120 million people—live in counties with unhealthy levels of air pollution, according to the 2023 State of the Air report by the American Lung Association (ALA). Since the annual report was first published, in 2000, its findings have shown how the Clean Air Act has been able to reduce harmful emissions from transportation, power plants, and manufacturing.
Recent findings, however, reflect how climate change–fueled wildfires and extreme heat are adding to the challenges of protecting public health. The latest report—which focuses on ozone, year-round particle pollution, and short-term particle pollution—also finds that people of color are 61 percent more likely than white people to live in a county with a failing grade in at least one of those categories, and three times more likely to live in a county that fails in all three.
In rankings for each of the three pollution categories covered by the ALA report, California cities occupy the top three slots (i.e., were highest in pollution), despite progress that the Golden State has made in reducing air pollution emissions in the past half century. At the other end of the spectrum, these cities consistently rank among the country’s best for air quality: Burlington, Vermont; Honolulu; and Wilmington, North Carolina.
Air pollution and environmental justice
No one wants to live next door to an incinerator, oil refinery, port, toxic waste dump, or other polluting site. Yet millions of people around the world do, and this puts them at a much higher risk for respiratory disease, cardiovascular disease, neurological damage, cancer, and death. In the United States, people of color are 1.5 times more likely than whites to live in areas with poor air quality, according to the ALA.
Historically, racist zoning policies and discriminatory lending practices known as redlining have combined to keep polluting industries and car-choked highways away from white neighborhoods and have turned communities of color—especially low-income and working-class communities of color—into sacrifice zones, where residents are forced to breathe dirty air and suffer the many health problems associated with it. In addition to the increased health risks that come from living in such places, the polluted air can economically harm residents in the form of missed workdays and higher medical costs.
Environmental racism isn't limited to cities and industrial areas. Outdoor laborers, including the estimated three million migrant and seasonal farmworkers in the United States, are among the most vulnerable to air pollution—and they’re also among the least equipped, politically, to pressure employers and lawmakers to affirm their right to breathe clean air.
Recently, cumulative impact mapping, which uses data on environmental conditions and demographics, has been able to show how some communities are overburdened with layers of issues, like high levels of poverty, unemployment, and pollution. Tools like the Environmental Justice Screening Method and the EPA’s EJScreen (which has been taken down by the second Trump administration) provide evidence of what many environmental justice communities have been explaining for decades: that we need land use and public health reforms to ensure that vulnerable areas are not overburdened and that the people who need resources the most are receiving them.
Controlling air pollution
In the United States, the Clean Air Act has been a crucial tool for reducing air pollution since its passage in 1970, although fossil fuel interests aided by industry-friendly lawmakers have frequently attempted to weaken its many protections. Ensuring that this bedrock environmental law remains intact and properly enforced will always be key to maintaining and improving our air quality.
But the best, most effective way to control air pollution is to speed up our transition to cleaner fuels and industrial processes. By switching over to renewable energy sources (such as wind and solar power), maximizing fuel efficiency in our vehicles, and replacing more and more of our gasoline-powered cars and trucks with electric versions, we'll be limiting air pollution at its source while also curbing the global warming that heightens so many of its worst health impacts.
And what about the economic costs of controlling air pollution? According to a report on the Clean Air Act commissioned by NRDC, the annual benefits of cleaner air are up to 32 times greater than the cost of clean air regulations. Those benefits include up to 370,000 avoided premature deaths, 189,000 fewer hospital admissions for cardiac and respiratory illnesses, and net economic benefits of up to $3.8 trillion for the U.S. economy every year.
How to help reduce air pollution
“The less gasoline we burn, the better we’re doing to reduce air pollution and the harmful effects of climate change,” Walke explains. “Make good choices about transportation. When you can, ride a bike, walk, or take public transportation. For driving, choose a car that gets better miles per gallon of gas or buy an electric car.” You can also investigate your power provider options—you may be able to request that your electricity be supplied by wind or solar. Buying your food locally cuts down on the fossil fuels burned in trucking or flying food in from across the world. And most important: “Support leaders who push for clean air and water and responsible steps on climate change,” Walke says.
How to protect your health
- “When you see in the news or hear on the weather report that pollution levels are high, it may be useful to limit the time when children go outside or you go for a jog,” Walke says. Generally, ozone levels tend to be lower in the morning.
- If you exercise outside, stay as far as you can from heavily trafficked roads. Then shower and wash your clothes to remove fine particles.
- The air may look clear, but that doesn’t mean it’s pollution free. Utilize tools like the EPA’s air pollution monitor, AirNow, to get the latest conditions. If the air quality is bad, stay inside with the windows closed.
- If you live or work in an area that’s prone to wildfires, stay away from the harmful smoke as much as you’re able. Consider keeping a small stock of masks to wear when conditions are poor. The most ideal masks for smoke particles will be labelled “NIOSH” (which stands for National Institute for Occupational Safety and Health) and have either “N95” or “P100” printed on it.
- If you’re using an air conditioner while outdoor pollution conditions are bad, use the recirculating setting to limit the amount of polluted air that gets inside.
This story was originally published on November 1, 2016, and has been updated with new information and links on October 31, 2023.
This NRDC.org story is available for online republication by news media outlets or nonprofits under these conditions: The writer(s) must be credited with a byline; you must note prominently that the story was originally published by NRDC.org and link to the original; the story cannot be edited (beyond simple things such as grammar); you can’t resell the story in any form or grant republishing rights to other outlets; you can’t republish our material wholesale or automatically—you need to select stories individually; you can’t republish the photos or graphics on our site without specific permission; you should drop us a note to let us know when you’ve used one of our stories.
Power plant standards help limit mercury, arsenic, lead, and other harmful air toxins.
But the Trump administration's EPA is planning on repealing these protections. Tell them no.

Defend lifesaving limits on power plant pollution
Power plants are responsible for one-third of U.S. carbon emissions. And yet, the Trump administration recently announced two proposals to repeal crucial carbon and toxic air pollution standards for power plants, endangering millions of Americans. Tell the EPA to keep these critical standards in place.
When Customers and Investors Demand Corporate Sustainability
What Are the Effects of Climate Change?
Fossil Fuel Air Pollution Kills One in Five People