What Are the Effects of Climate Change?
A rapidly warming planet poses an existential threat to all life on earth. Just how bad it gets depends on how quickly we act.
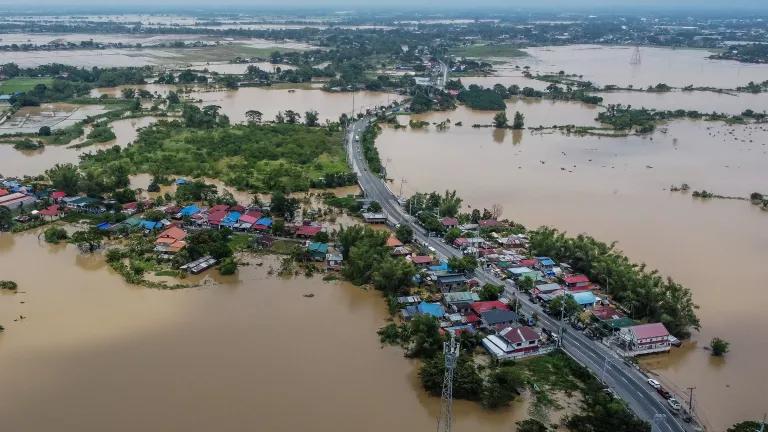
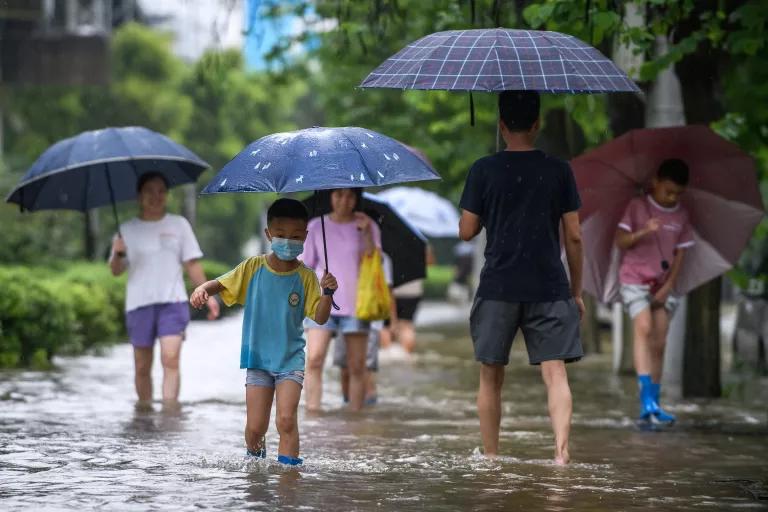
An area flooded by Super Typhoon Noru in the Bulacan Province of the Philippines, September 26, 2022
Rouelle Umali/Xinhua via Getty Images
Climate change is our planet’s greatest existential threat. If we don’t limit greenhouse gas emissions from the burning of fossil fuels, the consequences of rising global temperatures include massive crop and fishery collapse, the disappearance of hundreds of thousands of species, and entire communities becoming uninhabitable. While these outcomes may still be avoidable, climate change is already causing suffering and death. From raging wildfires and supercharged storms, its compounding effects can be felt today, outside our own windows.
Understanding these impacts can help us prepare for what’s here, what’s avoidable, and what’s yet to come, and to better prepare and protect all communities. Even though everyone is or will be affected by climate change, those living in the world’s poorest countries—which have contributed least to the problem—are the most climate-vulnerable. They have the fewest financial resources to respond to crises or adapt, and they’re closely dependent on a healthy, thriving natural world for food and income. Similarly, in the United States, it is most often low-income communities and communities of color that are on the frontlines of climate impacts. And because climate change and rising inequality are interconnected crises, decision makers must take action to combat both—and all of us must fight for climate justice. Here’s what you need to know about what we’re up against.
Effects of climate change on weather
As global temperatures climb, widespread shifts in weather systems occur, making events like droughts, hurricanes, and floods more intense and unpredictable. Extreme weather events that may have hit just once in our grandparents’ lifetimes are becoming more common in ours. However, not every place will experience the same effects: Climate change may cause severe drought in one region while making floods more likely in another.
Already, the planet has warmed 1.1 degrees Celsius (1.9 degrees Fahrenheit) since the preindustrial era began 250 years ago, according to the Intergovernmental Panel on Climate Change (IPCC). And scientists warn it could reach a worst-case scenario of 4 degrees Celsius (7.2 degrees Fahrenheit) by 2100 if we fail to tackle the causes of climate change—namely, the burning of fossil fuels (coal, oil, and gas).
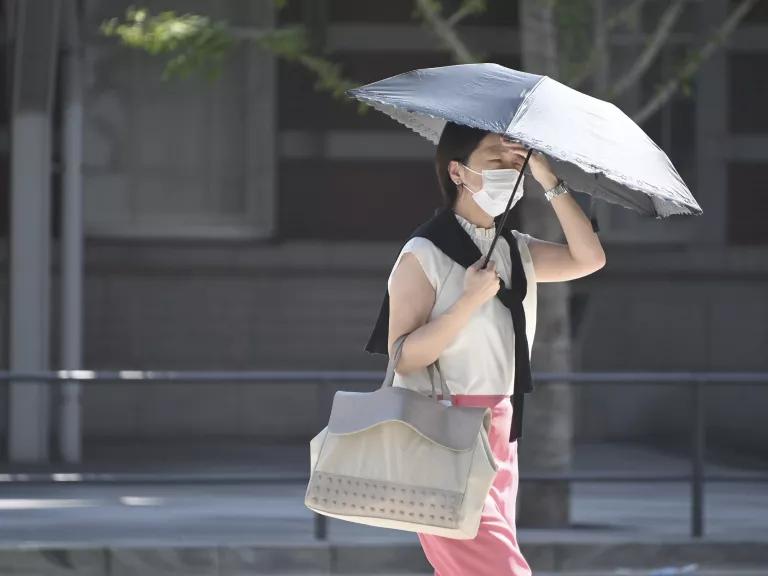
Tokyo during a record-breaking heat wave, August 13, 2020
The Yomiuri Shimbun via AP Images
Higher average temperatures
This change in global average temperature—seemingly small but consequential and climbing—means that, each summer, we are likely to experience increasingly sweltering heat waves. Even local news meteorologists are starting to connect strings of record-breaking days to new long-term trends, which are especially problematic in regions where infrastructure and housing have not been built with intensifying heat in mind. And heat waves aren’t just uncomfortable—they’re the leading cause of weather-related fatalities in the United States.
Longer-lasting droughts
Hotter temperatures increase the rate at which water evaporates from the air, leading to more severe and pervasive droughts. Already, climate change has pushed the American West into a severe “megadrought”—the driest 22-year stretch recorded in at least 1,200 years—shrinking drinking water supplies, withering crops, and making forests more susceptible to insect infestations. Drought can also create a positive feedback loop in which drier soil and less plant cover cause even faster evaporation.
More intense wildfires
This drier, hotter climate also creates conditions that fuel more vicious wildfire seasons—with fires that spread faster and burn longer—putting millions of additional lives and homes at risk. The number of large wildfires doubled between 1984 and 2015 in the western United States. And in California alone, the annual area burned by wildfires increased 500 percent between 1972 and 2018.
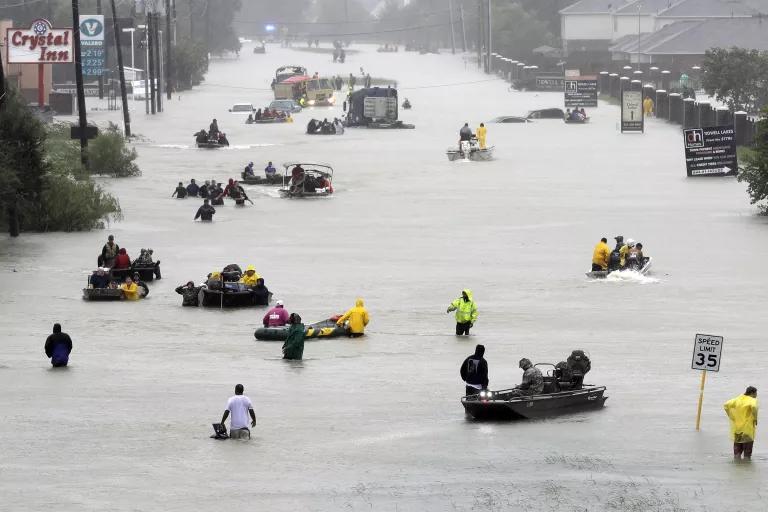
Evacuation after Hurricane Harvey in Houston, August 28, 2017
David J. Phillip/AP Photo
Stronger storms
Warmer air also holds more moisture, making tropical cyclones wetter, stronger, and more capable of rapidly intensifying. In the latest report from the IPCC, scientists found that daily rainfall during extreme precipitation events would increase by about 7 percent for each degree Celsius of global warming, increasing the dangers of flooding. The frequency of severe Category 4 and 5 hurricanes is also expected to increase. In 2017, Hurricane Harvey, a devastating Category 4 storm, dumped a record 275 trillion pounds of rain and resulted in dozens of deaths in the Houston area.
Effects of climate change on the environment
From the poles to the tropics, climate change is disrupting ecosystems. Even a seemingly slight shift in temperature can cause dramatic changes that ripple through food webs and the environment.
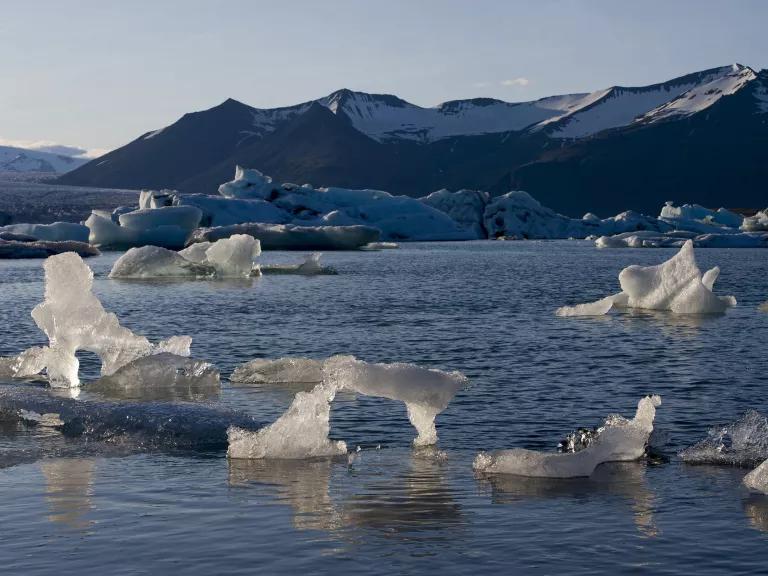
The lake at Jökulsárlón, a glacial lagoon in Iceland, which has grown because of continued glacial melting
Eskinder Debebe/UN Photo
Melting sea ice
The effects of climate change are most apparent in the world’s coldest regions—the poles. The Arctic is heating up twice as fast as anywhere else on earth, leading to the rapid melting of glaciers and polar ice sheets, where a massive amount of water is stored. As sea ice melts, darker ocean waters that absorb more sunlight become exposed, creating a positive feedback loop that speeds up the melting process. In just 15 years, the Arctic could be entirely ice-free in the summer.
Sea level rise
Scientists predict that melting sea ice and glaciers, as well as the fact that warmer water expands in volume, could cause sea levels to rise as much as 6.6 feet by the end of the century, should we fail to curb emissions. The extent (and pace) of this change would devastate low-lying regions, including island nations and densely populated coastal cities like New York City and Mumbai.
But sea level rise at far lower levels is still costly, dangerous, and disruptive. According to the 2022 Sea Level Rise Technical Report from the National Ocean Service, the United States will see a foot of sea level rise by 2050, which will regularly damage infrastructure, like roads, sewage treatment plants, and even power plants. Beaches that families have grown up visiting may be gone by the end of the century. Sea level rise also harms the environment, as encroaching seawater can both erode coastal ecosystems and invade freshwater inland aquifers, which we rely on for agriculture and drinking water. Saltwater incursion is already reshaping life in nations like Bangladesh, where one-quarter of the lands lie less than 7 feet above sea level.
A waterlogged road, caused by rainstorm and upstream flood discharge, in the Shaoguan, Guangdong Province of China, June 21, 2022
Stringer/Anadolu Agency via Getty Images
Flooding
In addition to coastal flooding caused by sea level rise, climate change influences the factors that result in inland and urban flooding: snowmelt and heavy rain. As global warming continues to both exacerbate sea level rise and extreme weather, our nation’s floodplains are expected to grow by approximately 45 percent by 2100. In 2022, deadly flooding in Pakistan—which inundated as much as a third of the country—resulted from torrential rains mixed with melting glaciers and snow.
Warmer ocean waters and marine heat waves
Oceans are taking the brunt of our climate crisis. Covering more than 70 percent of the planet’s surface, oceans absorb 93 percent of all the heat that’s trapped by greenhouse gases and up to 30 percent of all the carbon dioxide emitted from burning fossil fuels.
Temperature-sensitive fish and other marine life are already changing migration patterns toward cooler and deeper waters to survive, sending food webs and important commercial fisheries into disarray. And the frequency of marine heat waves has increased by more than a third. These spikes have led to mass die-offs of plankton and marine mammals.
To make matters worse, the elevated absorption of carbon dioxide by the ocean leads to its gradual acidification, which alters the fundamental chemical makeup of the water and threatens marine life that has evolved to live in a narrow pH band. Animals like corals, oysters, and mussels will likely feel these effects first, as acidification disrupts the calcification process required to build their shells.
Ecosystem stressors
Land-based ecosystems—from old-growth forests to savannahs to tropical rainforests—are faring no better. Climate change is likely to increase outbreaks of pests, invasive species, and pathogen infections in forests. It’s changing the kinds of vegetation that can thrive in a given region and disrupting the life cycles of wildlife, all of which is changing the composition of ecosystems and making them less resilient to stressors. While ecosystems have the capacity to adapt, many are reaching the hard limits of that natural capacity. More repercussions will follow as temperatures rise.
Climate change appears to be triggering a series of cascading ecological changes that we can neither fully predict nor, once they have enough momentum, fully stop. This ecosystem destabilization may be most apparent when it comes to keystone species that have an outsize- role in holding up an ecosystem’s structure.
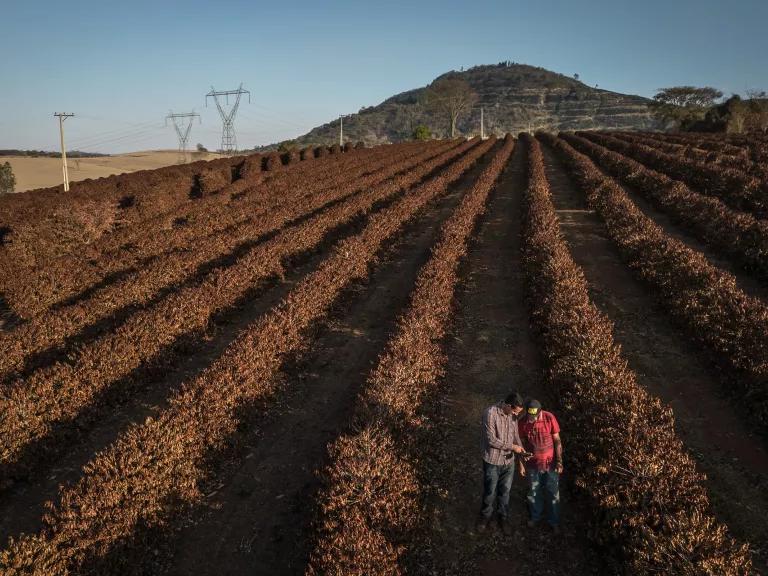
Coffee plants destroyed by frost due to extremely low temperatures near Caconde in the São Paulo state of Brazil, August 25, 2021
Jonne Roriz/Bloomberg via Getty Images
Effects of climate change on agriculture
Less predictable growing seasons
In a warming world, farming crops is more unpredictable—and livestock, which are sensitive to extreme weather, become harder to raise. Climate change shifts precipitation patterns, causing unpredictable floods and longer-lasting droughts. More frequent and severe hurricanes can devastate an entire season’s worth of crops. Meanwhile, the dynamics of pests, pathogens, and invasive species—all of which are costly for farmers to manage—are also expected to become harder to predict. This is bad news, given that most of the world’s farms are small and family-run. One bad drought or flood could decimate an entire season’s crop or herd. For example, in June 2022, a triple-digit heat wave in Kansas wiped out thousands of cows. While the regenerative agriculture movement is empowering rural communities to make their lands more resilient to climate change, unfortunately, not all communities can equitably access the support services that can help them embrace these more sustainable farming tactics.
Reduced soil health
Healthy soil has good moisture and mineral content and is teeming with bugs, bacteria, fungi, and microbes that in turn contribute to healthy crops. But climate change, particularly extreme heat and changes in precipitation, can degrade soil quality. These impacts are exacerbated in areas where industrial, chemical-dependent monoculture farming has made soil and crops less able to withstand environmental changes.
Food shortages
Ultimately, impacts to our agricultural systems pose a direct threat to the global food supply. And food shortages and price hikes driven by climate change will not affect everyone equally: Wealthier people will continue to have more options for accessing food, while potentially billions of others will be plummeted into food insecurity—adding to the billions that already have moderate or severe difficulty getting enough to eat.
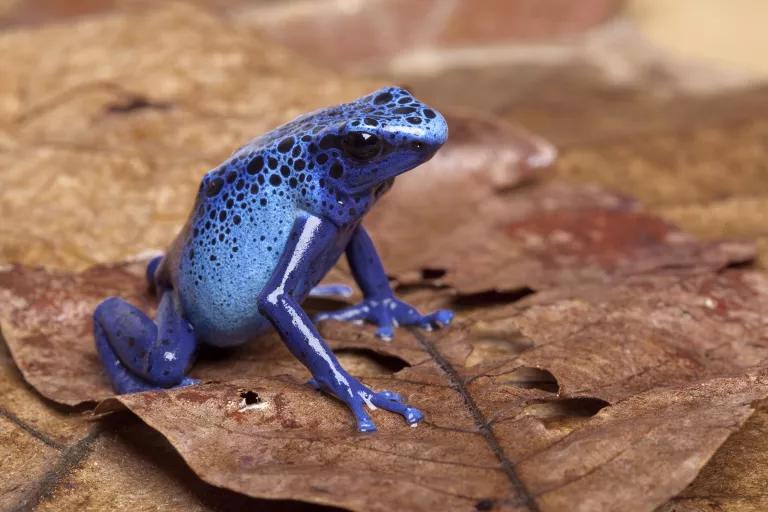
The poison dart frog’s survival is currently threatened by habitat loss and climate change.
Chris Mattison/Minden Pictures
Effects of climate change on animals
It’s about far more than just the polar bears: Half of all animal species in the world’s most biodiverse places, like the Amazon rainforest and the Galapagos Islands, are at risk of extinction from climate change. And climate change is threatening species that are already suffering from the biodiversity crisis, which is driven primarily by changes in land and ocean use (like converting wild places to farmland) and direct exploitation of species (like overfishing and wildlife trade). With species already in rough shape—more than 500,000 species have insufficient habitat for long-term survival—unchecked climate change is poised to push millions over the edge.
Climate change rapidly and fundamentally alters (or in some cases, destroys) the habitat that wildlife have incrementally adapted to over millennia. This is especially harmful for species’ habitats that are currently under threat from other causes. Ice-dependent mammals like walruses and penguins, for example, won’t fare well as ice sheets shrink. Rapid shifts in ocean temperatures stress the algae that nourishes coral reefs, causing reefs to starve—an increasingly common phenomenon known as coral bleaching. Disappearing wetlands in the Midwest’s Prairie Pothole Region means the loss of watering holes and breeding grounds for millions of migratory birds. (Many species are now struggling to survive, as more than 85 percent of wetlands have been lost since 1700). And sea level rise will inundate or erode away many coastal habitats, where hundreds of species of birds, invertebrates, and other marine species live.
Many species’ behaviors—mating, feeding, migration—are closely tied to subtle seasonal shifts, as in temperature, precipitation level, and foliage. In some cases, changes to the environment are happening quicker than species are able to adapt. When the types and quantity of plant life change across a region, or when certain species bloom or hatch earlier or later than in the past, it impacts food and water supplies and reverberates up food chains.
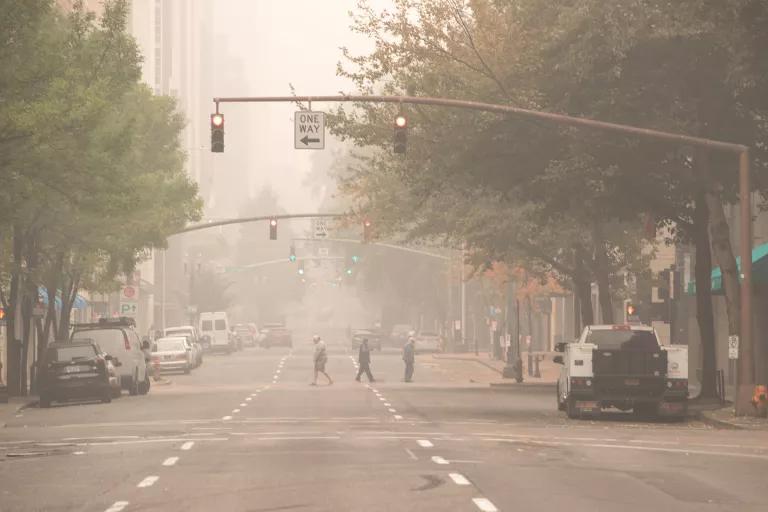
Wildfire smoke–filled air in Multnomah County, Oregon, September 16, 2020
Motoya Nakamura/Multnomah County Communications, CC BY NC-ND 4.0
Effects of climate change on humans
Ultimately, the way climate change impacts weather, the environment, animals, and agriculture affects humanity as well. But there’s more. Around the world, our ways of life—from how we get our food to the industries around which our economies are based—have all developed in the context of relatively stable climates. As global warming shakes this foundation, it promises to alter the very fabric of society. At worst, this could lead to widespread famine, disease, war, displacement, injury, and death. For many around the world, this grim forecast is already their reality. In this way, climate change poses an existential threat to all human life.
Human health
Climate change worsens air quality. It increases exposure to hazardous wildfire smoke and ozone smog triggered by warmer conditions, both of which harm our health, particularly for those with pre-existing illnesses like asthma or heart disease.
Insect-borne diseases like malaria and Zika become more prevalent in a warming world as their carriers are able to exist in more regions or thrive for longer seasons. In the past 30 years, the incidence of Lyme disease from ticks has nearly doubled in the United States, according to the U.S. Environmental Protection Agency (EPA). Thousands of people face injury, illness, and death every year from more frequent or more intense extreme weather events. At a 2-degree Celsius rise in global average temperature, an estimated one billion people will face heat stress risk. In the summer of 2022 alone, thousands died in record-shattering heat waves across Europe. Weeks later, dozens were killed by record-breaking urban flooding in the United States and South Korea—and more than 1,500 people perished in the flooding in Pakistan, where resulting stagnant water and unsanitary conditions threaten even more.
How does climate change impact public health? NRDC’s senior scientist Dr. Vijay Limaye explains how the climate crisis affects us all, whether you are worried about how much your utility bill will cost during a heat wave, experience displacement due to a flood, or live near an industrial facility that spews toxic air pollution.
The effects of climate change—and the looming threat of what’s yet to come—take a significant toll on mental health too. One 2021 study on climate anxiety, published in the journal Nature, surveyed 10,000 young people from 10 different countries. Forty-five percent of respondents said that their feelings about climate change, varying from anxiety to powerlessness to anger, impacted their daily lives.
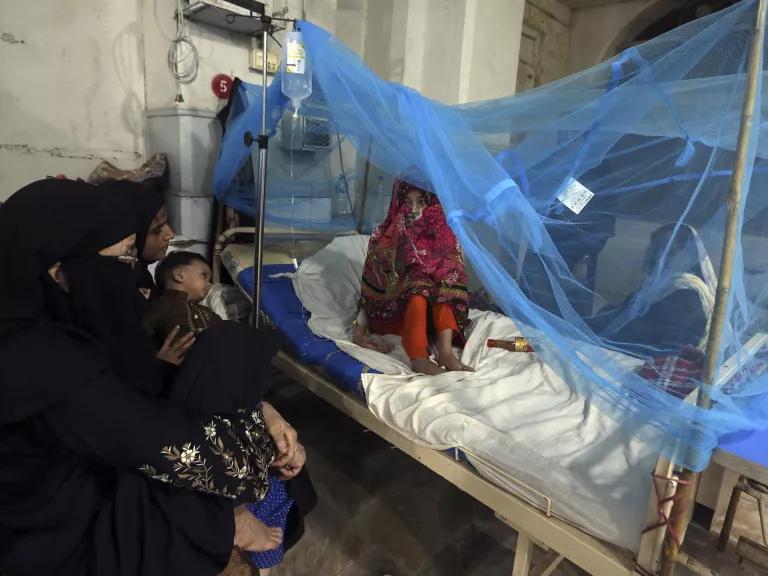
A patient with dengue fever, a mosquito-borne disease, in Karachi, Pakistan, where the spread of diseases worsened due to flooding, September 2022
Fareed Khan/AP Photo
Worsening inequity
The climate crisis exacerbates existing inequities. Though wealthy nations, such as the United States, have emitted the lion’s share of historical greenhouse gas emissions, it’s developing countries that may lack the resources to adapt and will now bear the brunt of the climate crisis. In some cases, low-lying island nations—like many in the Pacific—may cease to exist before developed economies make meaningful reductions to their carbon emissions.
Even within wealthier nations, disparities will continue to grow between those rich enough to shield themselves from the realities of climate change and those who cannot. Those with ample resources will not be displaced from their homes by wars over food or water—at least not right away. They will have homes with cool air during heat waves and be able to easily evacuate when a hurricane is headed their way. They will be able to buy increasingly expensive food and access treatment for respiratory illness caused by wildfire smoke. Billions of others can’t—and are paying the highest price for climate pollution they did not produce.
Hurricane Katrina, for example, displaced more than one million people around the Gulf Coast. But in New Orleans, where redlining practices promoted racial and economic segregation, the city’s more affluent areas tended to be located on higher ground—and those residents were able to return and rebuild much faster than others.
Displacement
Climate change will drive displacement due to impacts like food and water scarcities, sea level rise, and economic instability. It’s already happening. The United Nations Global Compact on Refugees recognizes that “climate, environmental degradation and disasters increasingly interact with the drivers of refugee movements.” Again, communities with the fewest resources—including those facing political instability and poverty—will feel the effects first and most devastatingly.
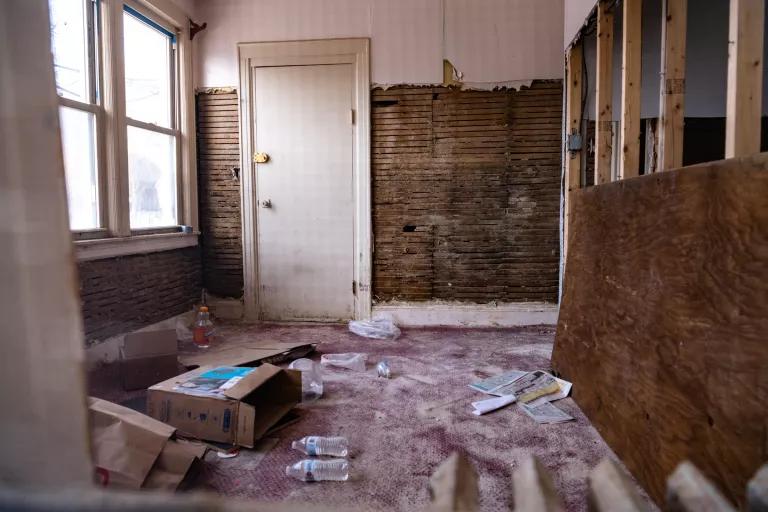
A flood-damaged home in Queens, New York, December 1, 2021
K.C. Wilsey/FEMA
Economic impacts
According to the 2018 National Climate Assessment, unless action is taken, climate change will cost the U.S. economy as much as $500 billion per year by the end of the century. And that doesn’t even include its enormous impacts on human health. Entire local industries—from commercial fishing to tourism to husbandry—are at risk of collapsing, along with the economic support they provide.
Recovering from the destruction wrought by extreme weather like hurricanes, flash floods, and wildfires is also getting more expensive every year. In 2021, the price tag of weather disasters in the United States totaled $145 billion—the third-costliest year on record, including a number of billion-dollar weather events.
Future effects of climate change
The first wave of impacts can already be felt in our communities and seen on the nightly news. The World Health Organization says that in the near future, between 2030 and 2050, climate change is expected to cause an additional 250,000 deaths per year from things like malnutrition, insect-borne diseases, and heat stress. And the World Bank estimates that climate change could displace more than 140 million people within their home countries in sub-Saharan Africa, South Asia, and Latin America by 2050.
But the degree to which the climate crisis upends our lives depends on whether global leaders decide to chart a different course. If we fail to curb greenhouse gas emissions, scientists predict a catastrophic 4.3 degrees Celsius, (or around 8 degrees Fahrenheit) of warming by the end of the century. What would a world that warm look like? Wars over water. Crowded hospitals to contend with spreading disease. Collapsed fisheries. Dead coral reefs. Even more lethal heat waves. These are just some of the impacts predicted by climate scientists.
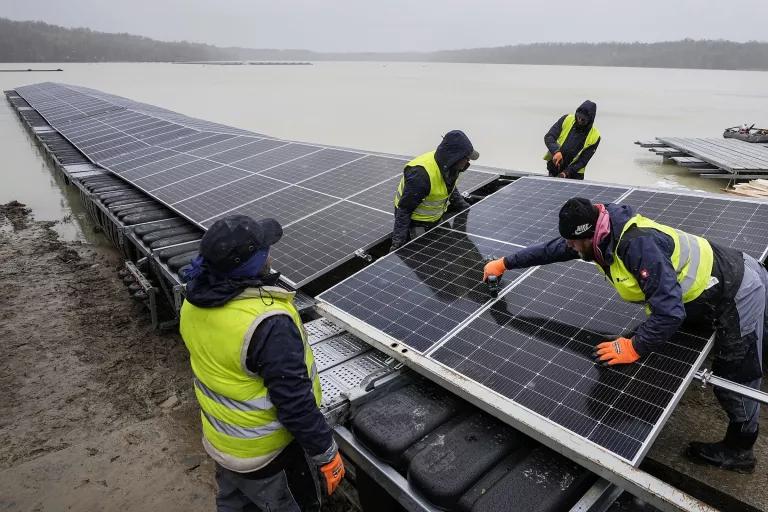
Solar panel installation at a floating photovoltaic plant on a lake in Haltern am See, Germany, April 2022
Martin Meissner/AP Photo
Climate mitigation, or our ability to reverse climate change and undo its widespread effects, hinges on the successful enactment of policies that yield deep cuts to carbon pollution, end our dependence on dangerous fossil fuels and the deadly air pollution they generate, and prioritize the people and ecosystems on the frontlines. And these actions must be taken quickly in order to ensure a healthier present day and future. In one of its latest reports, the IPCC presented its most optimistic emissions scenario, in which the world only briefly surpasses 1.5 degrees of warming but sequestration measures cause it to dip back below by 2100. Climate adaptation, a term that refers to coping with climate impacts, is no longer optional; it’s necessary, particularly for the world’s most vulnerable populations.
By following the urgent warnings of the IPCC and limiting warming, we may be able to avoid passing some of the critical thresholds that, once crossed, can lead to potentially irreversible, catastrophic impacts for the planet, including more warming. These thresholds are known as climate tipping points and refer to when a natural system "tips" into an entirely different state. One example would be Arctic permafrost, which stores carbon like a freezer: As the permafrost melts from warming temperatures, it releases carbon dioxide into the atmosphere.
Importantly, climate action is not a binary pass-fail test. Every fraction of a degree of warming that we prevent will reduce human suffering and death, and keep more of the planet’s natural systems intact. The good news is that a wide range of solutions exist to sharply reduce emissions, slow the pace of warming, and protect communities on the frontlines of climate impacts. Climate leaders the world over—those on major political stages as well as grassroots community activists—are offering up alternative models to systems that prioritize polluters over people. Many of these solutions are rooted in ancestral and Indigenous understandings of the natural world and have existed for millennia. Some solutions require major investments into clean, renewable energy and sustainable technologies. To be successful, climate solutions must also address intersecting crises—like poverty, racism, and gender inequality—that compound and drive the causes and impacts of the climate crisis. A combination of human ingenuity and immense political will can help us get there.
This NRDC.org story is available for online republication by news media outlets or nonprofits under these conditions: The writer(s) must be credited with a byline; you must note prominently that the story was originally published by NRDC.org and link to the original; the story cannot be edited (beyond simple things such as grammar); you can’t resell the story in any form or grant republishing rights to other outlets; you can’t republish our material wholesale or automatically—you need to select stories individually; you can’t republish the photos or graphics on our site without specific permission; you should drop us a note to let us know when you’ve used one of our stories.
Power plants are already responsible for one-third of U.S. carbon emissions.
But the Trump administration's EPA wants to slash power plant standards that help protect our climate and health. Tell them no.

Defend lifesaving limits on power plant pollution
Power plants are responsible for one-third of U.S. carbon emissions. And yet, the Trump administration recently announced two proposals to repeal crucial carbon and toxic air pollution standards for power plants, endangering millions of Americans. Tell the EPA to keep these critical standards in place.
When Customers and Investors Demand Corporate Sustainability
COP27: The Issues, the Tensions, and the Urgent Need for Unity on Climate
Mutual Aid and Disaster Justice: “We Keep Us Safe”