Fossil Fuels: The Dirty Facts
Mining, drilling, and burning dirty energy are harming the environment and our health. Here’s everything you need to know about fossil fuels and why we need to embrace a clean energy future.

An oil slick
Sakhorn Saengtongsamarnsin/123RF
For more than a century, burning fossil fuels has generated most of the energy required to propel our cars, power our businesses, and keep the lights on in our homes. Even today, oil, coal, and gas serve about 80 percent of our energy needs, according to the U.S. Energy Information Administration.
And we’re paying the price. Using fossil fuels for energy has exacted an enormous toll on humanity and the environment—from air and water pollution to increasingly intense and unpredictable extreme weather events and myriad other effects of climate change. That’s beyond all the negative impacts from petroleum-based products such as plastics and chemicals. Here’s a look at what fossil fuels are, what they cost us (beyond the wallet), and why it’s time to move toward a clean energy future.
What are fossil fuels?
Coal, crude oil, and natural gas are all considered fossil fuels because they were formed from the fossilized, buried remains of plants and animals that lived millions of years ago. Because of their origins, fossil fuels have a high carbon content.
Examples of fossil fuels
Oil
Crude oil, or petroleum (literally “rock oil” in Latin), is a liquid fossil fuel made up mostly of hydrocarbons (hydrogen and carbon compounds). Oil can be found in underground reservoirs; in the cracks, crevices, and pores of sedimentary rock; or in tar sands near the earth’s surface. It’s accessed by drilling, on land or at sea, or by strip mining in the case of tar sands oil and oil shale. Once extracted, oil is transported to refineries via supertanker, train, truck, or pipeline to be transformed into usable fuels such as gasoline, propane, kerosene, and jet fuel, as well as products such as plastics and paint.
According to the EIA, petroleum products supply about 38 percent of U.S. energy needs, with the transportation sector consuming the most. Thanks to increased energy efficiency and the growth of renewables, U.S. oil consumption has stayed relatively level over the past two decades, despite the U.S. economy growing by 50 percent over the same time period.
On the fossil fuel production side, the United States has experienced a decade-long upswing. Production growth is due in large part to advancements in horizontal drilling and hydraulic fracturing (aka fracking). While horizontal drilling enables producers to drill down and outward—thus reaching more oil or gas from a single well—hydraulic fracturing is designed to extract oil or natural gas from unyielding rock, including shale and other formations. Fracking involves blasting huge quantities of water mixed with chemicals and sand deep into a well, at pressures high enough to fracture rock and enable the oil or gas to escape.
The EIA estimates production of crude oil will peak by 2027 and then begin to decline at the end of the decade—but that trajectory depends on continued strengthening of clean car and fuel economy standards. And the Trump administration’s relentless efforts to undo decades of environmental progress is likely to impact this forecast.
Coal
Coal is a solid, carbon-heavy rock that comes in four main varieties, differentiated largely by carbon content: lignite, subbituminous, bituminous, and anthracite. Nearly all of the coal burned in the United States is subbituminous or bituminous. Found in abundance in states likeKentucky, Pennsylvania, West Virginia, and Wyoming, these coal types are middle of the pack in terms of carbon content and the heat energy they can produce. Regardless of variety, however, all coal causes toxic pollution of our air, land, and water—and its toxic legacy continues to plague communities that surround the industry’s dirty facilities. And in terms of emissions, it’s the most carbon-intensive fossil fuel we can burn.
Coal is extracted via two methods: Underground mining uses heavy machinery to cut coal from deep underground deposits, while surface mining (also known as strip mining) removes entire layers of soil and rock to access coal deposits below. Strip mining accounts for about two-thirds of coal sourced in the United States. Although both forms of mining are detrimental to the environment, strip mining is particularly destructive, uprooting and polluting entire ecosystems.
NRDC’s director of policy analysis, Amanda Levin, explains how coal plant pollution surged across the country last year, thanks to Trump’s presidential exemptions, and how that has subsequently created billions of dollars in public health costs for local communities.
Coal and the power plants that burn it account for only about 16 percent of U.S. electricity generation, less than half the amount from its peak in 2008. Cleaner, cheaper alternatives—including natural gas, renewables like solar and wind, and energy-efficient technologies—make coal far less economically attractive, and demand for coal has fallen steadily since 2014. Indeed, nearly half of the country’s coal-fired power plants have retired in recent years due to being too expensive to run. As coal production declines across the board, the second Trump administration is trying to revive the dying industry by signing several executive orders to expand coal mining on federal lands and exempt coal plants from complying with clean air standards. But it is clear that coal has no place on our modern-day grid. .
Natural gas
Composed mostly of methane (the second-most damaging climate pollutant), natural gas is generally considered either conventional or unconventional, depending on where it’s found underground. Conventional gas is located in porous and permeable rock beds or mixed into oil reservoirs and can be accessed via standard drilling. Unconventional gas is essentially any form of gas that is too difficult or expensive to extract via regular drilling, requiring a special stimulation technique, such as fracking.
In the United States, the development and refinement of processes like fracking have helped make the country the world’s top producer of gas (and oil) since 2009—and the biggest consumer. Abundant in the United States, natural gas is used to meet 36 percent of U.S. energy needs. Because its extraction far exceeds domestic demand for gas, the industry has ramped up its export trade in recent years. U.S. exports of liquefied natural gas (LNG) grew a staggering 450 percent between 2017 and 2022, and it’s on track to more than double by 2028, from 2024. The United States is now the world’s biggest LNG exporter.
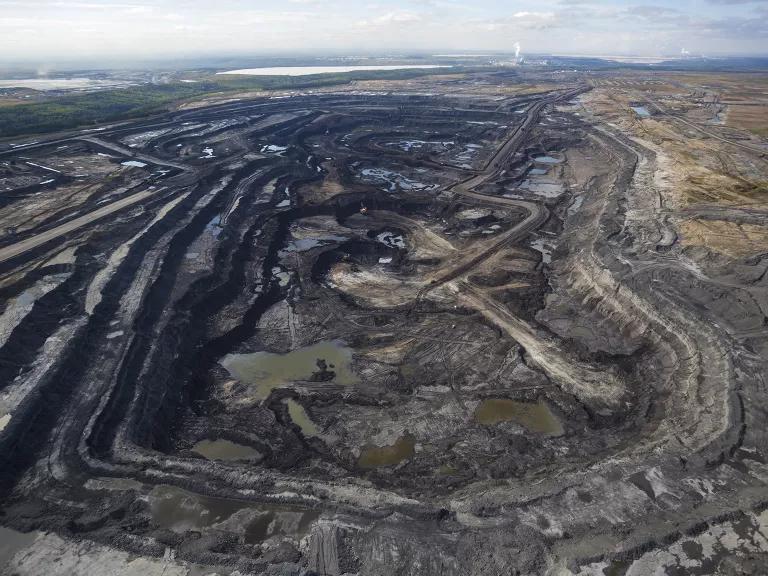
An aerial view of tar sands mining in Fort McMurray, Alberta, Canada.
Dan Barnes Photography/iStock
Disadvantages of fossil fuels
Land degradation
Unearthing, processing, and moving underground oil, gas, and coal deposits take an enormous toll on our landscapes and ecosystems. The fossil fuel industry leases vast stretches of land for infrastructure, such as wells, pipelines, and access roads, as well as facilities for processing, waste storage, and waste disposal. In the case of strip mining, entire swaths of terrain—including forests and whole mountaintops—are scraped and blasted away to expose underground coal or oil. Even after operations cease, the nutrient-leached land will never return to what it once was.
As a result, critical wildlife habitat ends up fragmented and destroyed, affecting breeding, migration, and other life cycle events and exacerbating the pressure on our planet’s biodiversity.
Water pollution
Coal, oil, and gas development pose myriad threats to our waterways and groundwater. Coal mining operations wash toxic runoff into streams, rivers, and lakes and dump vast quantities of unwanted rock and soil into streams. Oil spills and leaks during extraction or transport can pollute drinking water sources and jeopardize entire freshwater or ocean ecosystems. Fracking and its toxic fluids have also been found to contaminate drinking water, a fact that the U.S. Environmental Protection Agency (EPA) was slow to recognize.
Meanwhile, all drilling, fracking, and mining operations generate enormous volumes of wastewater, which can be laden with heavy metals, radioactive materials, and other pollutants. Industries store this waste in open-air pits or underground wells that can leak or overflow into waterways and contaminate aquifers with pollutants linked to cancer, birth defects, neurological damage, and much more.
Air pollution
Fossil fuels emit harmful air pollutants long before they’re burned. Active oil and gas wells (and even the millions of orphaned and abandoned ones) can leak benzene (linked to childhood leukemia and blood disorders) and formaldehyde (a cancer-causing chemical). A 2023 study estimated that air pollution from the oil and gas industry caused 7,500 excess deaths and $77 billion in health care impacts in just a single year. A booming fracking industry will bring that pollution to more backyards, despite mounting evidence of the practice’s serious health impacts. Mining operations are no better, especially for the miners themselves, generating toxic airborne particulate matter.
Burning fossil fuels
Climate pollution
When we burn oil, coal, and gas, we produce large quantities of carbon dioxide. These carbon emissions trap heat in the atmosphere and lead to climate change. In the United States, the burning of fossil fuels, particularly for the power and transportation sectors, accounts for about three-quarters of our carbon emissions.
Other forms of air pollution
Fossil fuels emit more than just carbon dioxide when burned. Coal-fired power plants are the largest U.S. source of mercury emissions, which can lead to brain and developmental issues in children and cardiovascular, fine motor function, and memory problems for adults. These plants also emit arsenic and benzene from their smokestacks, both of which are known carcinogens, as well as soot (particulate matter) and sulfur dioxide (which contribute to acid rain). Meanwhile, fossil fuel–powered cars and trucks are the main contributors of poisonous carbon monoxide and nitrogen oxides, which produce smog on hot days and can lead to respiratory illnesses in people who experience sustained exposure.
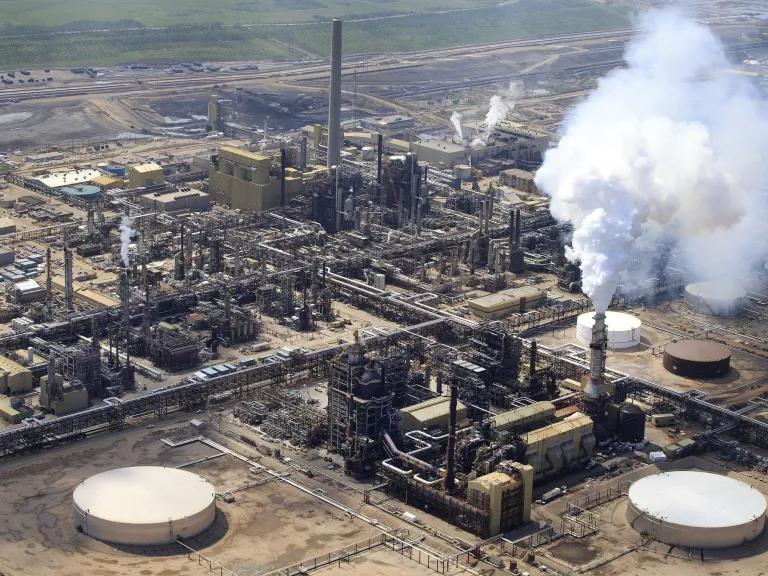
The Syncrude Mildred Lake oil sands plant near Fort McMurray in Alberta, Canada
Larry MacDougal/AP
Ocean acidification
When we burn oil, coal, and gas, the carbon that’s emitted changes the ocean’s basic chemistry, making it more acidic. Our seas absorb as much as 30 percent of all man-made carbon emissions. As the acidity in our waters goes up, the amount of calcium carbonate—a substance used by oysters, lobsters, and countless other marine organisms to form shells—goes down. This can slow growth rates, weaken shells, and imperil entire food chains.
Ocean acidification impacts coastal communities as well. In the Pacific Northwest, it’s estimated to have cost the oyster industry millions of dollars and thousands of jobs.
Building a clean energy future
The second Trump administration has launched a full-scale attack on our clean energy future. On top of pulling the United States out of the Paris Agreement for the second time and abandoning our commitments to reducing greenhouse gas emissions, our federal leaders have gutted clean energy subsidies, canceled large offshore wind and solar projects, rolled back clean vehicle standards, and opened up our coastlines for offshore drilling. Trump’s EPA reversed Biden-era pollution standards that were set for power plants to reduce toxic air pollutants, and the Department of the Interior announced plans to open up 13 million acres of land in Alaska for oil and gas drilling.
This is a lot of bad news. The good news is we’re not locked into a fossil fuel future. We’ve made major progress in scaling up renewable energy and energy efficiency in the United States over the past decade due to prior federal, state, and local policies that have helped to grow the clean energy economy.
Thanks to technological advances and scaling up production, renewable energy is already cheaper than fossil fuels in some cases. The International Renewable Energy Agency found that 91 percent of the newly commissioned clean energy projects around the world last year were cheaper than fossil fuel alternatives. In the United States, many companies are resolved to continue pushing forward with clean energy projects, including in rural states.
Meanwhile, energy efficiency is our cleanest, cheapest, and largest energy resource, contributing more to the nation’s energy needs over the past 40 years than oil, coal, natural gas, or nuclear power. In 2023, U.S. jobs in this sector numbered 2.2 million—double the amount of workers in the entire fossil fuel industry.
As we face another term with a pro–fossil fuels president, it will be up to states, cities, and communities to keep the momentum going. Two dozen states have committed to upholding the goals of the Paris Agreement, and many cities have also stepped up with their own climate action plans. Achieving a clean energy future will require sustained and coordinated policy efforts, stepped up commitments from the private sector, and the collective power of people on the ground, pushing for change.
This story was originally published on June 29, 2018, and has been updated with new information and links.
This NRDC.org story is available for online republication by news media outlets or nonprofits under these conditions: The writer(s) must be credited with a byline; you must note prominently that the story was originally published by NRDC.org and link to the original; the story cannot be edited (beyond simple things such as grammar); you can’t resell the story in any form or grant republishing rights to other outlets; you can’t republish our material wholesale or automatically—you need to select stories individually; you can’t republish the photos or graphics on our site without specific permission; you should drop us a note to let us know when you’ve used one of our stories.
Families will be forced to pay billions to keep outdated coal and gas plants running.
The Trump administration is halting offshore wind projects, threatening clean energy jobs and raising utility bills. Congress must step in now to defend offshore wind.

Tell Congress to protect offshore wind—and our economy!
Instead of delivering affordable, reliable clean energy, the Trump administration is forcing families to pay billions to keep outdated coal and gas plants running—threatening clean energy jobs and raising utility bills. Congress must step in now to defend offshore wind.
Venezuela’s Oil Resources Are Vast (and Should Stay Underground)
No, We’re Not in an Emergency Energy Crisis
How to Spot—and Help Stop—Climate Misinformation