Global Warming 101
Everything you wanted to know about our changing climate but were too afraid to ask.
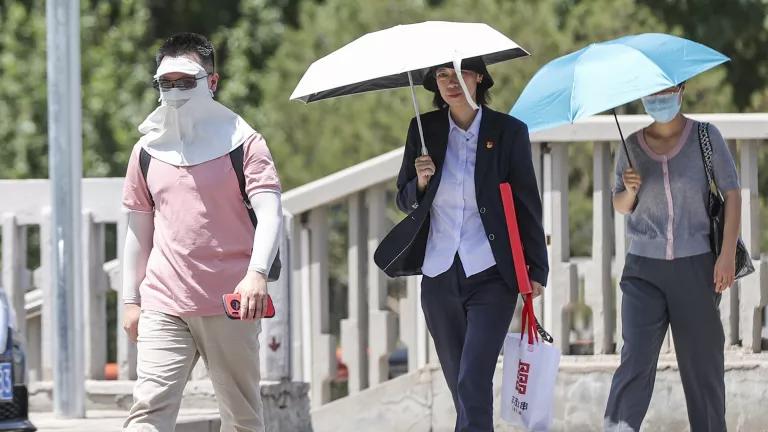
Temperatures in Beijing rose above 104 degrees Fahrenheit on July 6, 2023.
Jia Tianyong/China News Service/VCG via Getty Images
As we see extreme weather events growing—in number and in intensity—all around us, it is evident that climate change is a crisis that must be tackled. But in order to find the solutions, we must know the basics around global warming.
What is global warming?
Since the Industrial Revolution, the global annual temperature has increased in total by a little more than 1 degree Celsius, or about 2 degrees Fahrenheit. Between 1850—the year that accurate recordkeeping began—and 1980, it rose on average by 0.07 degrees Celsius (0.13 degrees Fahrenheit) every 10 years. Since 1981, however, the rate of increase has more than doubled: For the last 40 years, we’ve seen the global annual temperature rise by 0.2 degrees Celsius, or 0.36 degrees Fahrenheit, per decade.
The result? A planet that has never been hotter. The 10 most recent years are the warmest years on record. And the warmer it gets, the more probable it becomes that we trigger climate tipping points (such as rapid glacier melt or thawing permafrost) that can transform natural systems into entirely different states and lead to more warming.
In 2015, the Paris Agreement codified the recommendation of climate scientists to limit global warming to 1.5 degrees Celsius. Working toward that goal continues to give us our best chance to stave off the worst, most devastating effects of climate change: the extreme droughts, wildfires, floods, tropical storms, and other disasters that are so widespread and costly to both our infrastructure and our health.
What causes global warming?
Global warming results from the increasing concentration of carbon dioxide (CO2) and other greenhouse gases that trap heat in the earth’s atmosphere. This trapped energy comes from incoming solar radiation absorbed by the earth’s surface and re-radiated back into the atmosphere as infrared energy.
Though natural cycles and fluctuations have caused the planet's climate to change continually over the last 800,000 years, it is human activity that has driven our current era of global warming. In particular, our burning of fossil fuels—such as coal, oil, gasoline, and natural gas—has led to the greenhouse effect. In the United States, the largest source of greenhouse gases is transportation, followed closely by electricity production and industrial activity. (Learn about the natural and human causes of climate change.)
To support global efforts to limit warming to 1.5 degrees Celsius, the United States now faces the monumental (yet achievable) task of cutting greenhouse gas emissions to net zero no later than 2050. We also must fulfill our commitments to help developing nations meet their climate goals—a responsibility that we (and other rich, polluting nations) are currently falling short on. In better news, countries continue to work toward scaling up climate finance to developing countries to at least $1.3 trillion per year by 2035.
How is global warming linked to extreme weather?
As the earth’s atmosphere heats up, it holds more water, changing weather patterns and fueling more severe rainfall events. At the same time, warmer air causes more moisture to evaporate from the planet’s surface in dry weather, resulting in more frequent and intense droughts and heat waves.
A 2023 paper by two NASA scientists published in the journal Nature Water confirmed the “wet-gets-wetter, dry-gets-drier hypothesis” through a review of extreme weather events across five continents from 2002 to 2021. Among the most dramatic was a pluvial (intense period of rainfall) that began in 2019 in central Africa and was still ongoing as the study concluded. The event caused Lake Victoria’s water levels to rise by more than 3 feet and resulted in severe flooding in surrounding areas. Meanwhile a 2015–'16 drought in Brazil led to empty reservoirs and water rationing across some cities. The scientists concluded that “the global total intensity of major extreme events appears to be increasing as the world warms.”
Ocean temperatures are getting warmer too—which means that tropical storms can pick up more energy. The 2020 Atlantic hurricane season included a record-breaking 30 tropical storms, 6 major hurricanes, and 13 hurricanes altogether. With increased intensity comes increased damage and death, particularly as coastal populations grow and coastal development accelerates. Billion-dollar weather and climate disasters have been increasing in recent years; the United States experienced an unprecedented 28 of these in 2023.
What are the other effects of global warming?
Each year scientists learn more about the consequences of global warming, and each year we also gain new evidence of its devastating impact on people and the planet. They touch on every facet of our lives—our economy and livelihoods, our health, our food supply, and our ways of life. Heat stress is killing workers. Allergies, asthma, and infectious disease outbreaks are becoming more common due to increased growth of pollen-producing ragweed, higher levels of air pollution, and the spread of conditions favorable to ticks and mosquitoes. Communities are migrating from scorched or flooded homelands. Melting ice is reshaping environments and impacting lives from the mountains to the coasts. (Learn more about the effects of climate change.)
Though everyone is affected by climate change, not everyone is affected equally. Indigenous Peoples, people of color, and the economically marginalized are typically hit the hardest, due in part to environmental racism. Inequities built into our housing, health care, and labor systems make these communities more vulnerable to the worst impacts of climate change—even though these same communities have done the least to contribute to it.
How does climate change impact public health? NRDC’s senior scientist Dr. Vijay Limaye explains how the climate crisis affects us all, whether you are worried about how much your utility bill will cost during a heat wave, experience displacement due to a flood, or live near an industrial facility that spews toxic air pollution.
Where does the United States stand in terms of global-warming contributors?
In recent years, China has taken the lead in global-warming pollution, producing about 26 percent of all CO2 emissions. The United States comes in second. Despite making up just 4 percent of the world’s population, our nation produces a sobering 13 percent of all global CO2 emissions—nearly as much as the European Union and India (third and fourth place) combined.
And America is still number one, by far, in cumulative emissions over the past 150 years. Given this outsize role in accelerating global warming, the United States must step up its financial commitments to bringing about a cleaner, safer, and more equitable future. (And even as the federal government is now retreating from its obligations under global climate agreements, these decisions can be reversed by future U.S. administrations.) Our responsibility matters to other countries, and it should matter to us, too.
Is the United States doing anything to prevent global warming?
We’ve started. But in order to avoid the worsening effects of climate change, we need to do a lot more—together with other countries—to reduce our dependence on fossil fuels and transition to clean energy sources.
Under the first—and now, the second—administration of President Donald Trump, the United States withdrew from the Paris Agreement, rolled back or eliminated dozens of clean air protections, and opened up federally managed lands, including culturally sacred national monuments, to fossil fuel development. This climate-backpedaling represents a sharp U-turn from policies passed under the administration of President Joe Biden, such as the Bipartisan Infrastructure Law, the Inflation Reduction Act, and the Justice40 Initiative.
Coupled with the work of the EPA to rein in the largest sources of climate pollution across the energy and transportation sectors, those initiatives brought us significantly closer to meeting our climate goals. Evidence has shown that the United States was on track to reduce its GHG emissions by 38 to 56 percent below 2005 levels in 2035, a significant increase from the pace of annual emissions abatement from 2005 to 2023. However, that progress is now uncertain.
Despite the lack of cooperation from the Trump administration, local and state governments have continued to make strides, including in clean transportation, community adaptation planning, and food waste reduction (a major source of greenhouse gases). Meanwhile, industry and business leaders continue to create and adopt new clean energy technologies and increase energy efficiency in buildings, appliances, and industrial processes. This public-private sector collaboration remains key to achieving our climate goals.
The trends of renewable energy uptake and clean transportation also continue around the world: Despite headwinds, investment in green power during the first half of 2025 increased by 10 percent from the previous year, and one out of every five cars sold globally was an electric vehicle. In the United States, these trends have also fueled record job growth—at the beginning of 2024, 3.4 million workers were employed in clean energy.
Is global warming too big a problem for me to help tackle?
No! While we can’t win the fight with federal leaders who are actively thwarting climate action, the voices and actions of individuals who are willing to hold government and industry leaders to account and make changes in their daily habits continue to matter.
Wondering how you can be a part of the fight against global warming? Reduce your own carbon footprint by taking a few easy steps: Make conserving energy a part of your daily routine and your decisions as a consumer. From buying a car to shopping for basic staples like toilet paper, there are many ways to support sustainable products and help push companies to clean up their act. After all, corporations are incredibly influential as drivers of the global economy. It’s also critical to keep voicing your support of climate-friendly and climate change preparedness policies. Tell your representatives that equitably transitioning from dirty fossil fuels to clean power should be a top priority—because it’s vital to building healthy, more secure communities.
You don’t have to go it alone, either. Movements across the country are showing how climate action can build community, be led by those on the frontlines of its impacts, and create a future that’s equitable and just for all.
This story was originally published on March 11, 2016 and has been updated with new information and links.
This NRDC.org story is available for online republication by news media outlets or nonprofits under these conditions: The writer(s) must be credited with a byline; you must note prominently that the story was originally published by NRDC.org and link to the original; the story cannot be edited (beyond simple things such as grammar); you can’t resell the story in any form or grant republishing rights to other outlets; you can’t republish our material wholesale or automatically—you need to select stories individually; you can’t republish the photos or graphics on our site without specific permission; you should drop us a note to let us know when you’ve used one of our stories.
Venezuela’s Oil Resources Are Vast (and Should Stay Underground)
How to Spot—and Help Stop—Climate Misinformation
Climate Misinformation on Social Media Is Undermining Climate Action