Water Pollution: Everything You Need to Know
Our rivers, reservoirs, lakes, and seas are drowning in chemicals, waste, plastic, and other pollutants. Here’s why—and what you can do to help.
What is water pollution?
Water pollution occurs when harmful substances—often chemicals or microorganisms—contaminate a stream, river, lake, ocean, aquifer, or other body of water, degrading water quality and rendering it toxic to humans or the environment.
This widespread problem of water pollution is jeopardizing our health. Unsafe water kills more people each year than war and all other forms of violence combined. Meanwhile, our drinkable water sources are finite: Less than 1 percent of the earth’s freshwater is actually accessible to us. Without action, the challenges will only increase by 2050, when global demand for freshwater is expected to be one-third greater than it is now.
What are the causes of water pollution?
Water is uniquely vulnerable to pollution. Known as a “universal solvent,” water is able to dissolve more substances than any other liquid on earth. It’s the reason we have Kool-Aid and brilliant blue waterfalls. It’s also why water is so easily polluted. Toxic substances from farms, towns, and factories readily dissolve into and mix with it, causing water pollution.
Here are some of the major sources of water pollution worldwide:
Agricultural
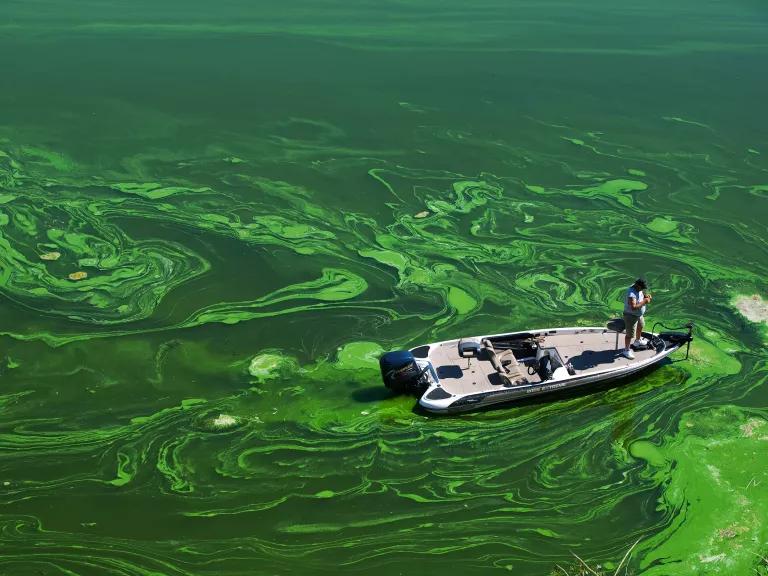
Toxic green algae in Copco Reservoir, northern California
Aurora Photos/Alamy
Not only is the agricultural sector the biggest consumer of global freshwater resources, with farming and livestock production using about 70 percent of the earth’s surface water supplies, but it’s also a serious water polluter. Around the world, agriculture is the leading cause of water degradation. In the United States, agricultural pollution is the top source of contamination in rivers and streams, the second-biggest source in wetlands, and the third main source in lakes. It’s also a major contributor of contamination to estuaries and groundwater. Every time it rains, fertilizers, pesticides, and animal waste from farms and livestock operations wash nutrients and pathogens—such bacteria and viruses—into our waterways. Nutrient pollution, caused by excess nitrogen and phosphorus in water or air, is the number-one threat to water quality worldwide and can cause algal blooms, a toxic soup of blue-green algae that can be harmful to people and wildlife.
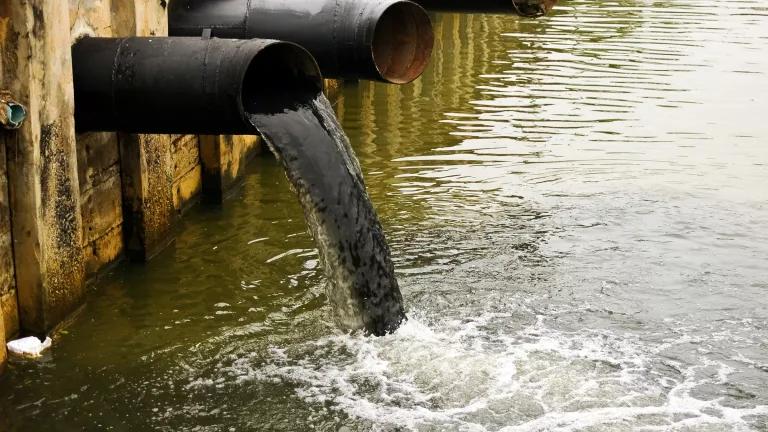
Sewage and wastewater
Used water is wastewater. It comes from our sinks, showers, and toilets (think sewage) and from commercial, industrial, and agricultural activities (think metals, solvents, and toxic sludge). The term also includes stormwater runoff, which occurs when rainfall carries road salts, oil, grease, chemicals, and debris from impermeable surfaces into our waterways
More than 80 percent of the world’s wastewater flows back into the environment without being treated or reused, according to the United Nations; in some least-developed countries, the figure tops 95 percent. In the United States, wastewater treatment facilities process about 34 billion gallons of wastewater per day. These facilities reduce the amount of pollutants such as pathogens, phosphorus, and nitrogen in sewage, as well as heavy metals and toxic chemicals in industrial waste, before discharging the treated waters back into waterways. That’s when all goes well. But according to EPA estimates, our nation’s aging and easily overwhelmed sewage treatment systems also release more than 850 billion gallons of untreated wastewater each year.
Oil pollution
Big spills may dominate headlines, but consumers account for the vast majority of oil pollution in our seas, including oil and gasoline that drips from millions of cars and trucks every day. Moreover, nearly half of the estimated 1 million tons of oil that makes its way into marine environments each year comes not from tanker spills but from land-based sources such as factories, farms, and cities. At sea, tanker spills account for about 10 percent of the oil in waters around the world, while regular operations of the shipping industry—through both legal and illegal discharges—contribute about one-third. Oil is also naturally released from under the ocean floor through fractures known as seeps.
Radioactive substances
Radioactive waste is any pollution that emits radiation beyond what is naturally released by the environment. It’s generated by uranium mining, nuclear power plants, and the production and testing of military weapons, as well as by universities and hospitals that use radioactive materials for research and medicine. Radioactive waste can persist in the environment for thousands of years, making disposal a major challenge. Consider the decommissioned Hanford nuclear weapons production site in Washington, where the cleanup of 56 million gallons of radioactive waste is expected to cost more than $100 billion and last through 2060. Accidentally released or improperly disposed of contaminants threaten groundwater, surface water, and marine resources.
Categories of water pollution
To address pollution and protect water we need to understand where the pollution is coming from (point source or nonpoint source) and the type of water body its impacting (groundwater, surface water, or ocean water).
Where is the pollution coming from?
Point source pollution
When contamination originates from a single source, it’s called point source pollution. Examples include wastewater (also called effluent) discharged legally or illegally by a manufacturer, oil refinery, or wastewater treatment facility, as well as contamination from leaking septic systems, chemical and oil spills, and illegal dumping. The EPA regulates point source pollution by establishing limits on what can be discharged by a facility directly into a body of water. While point source pollution originates from a specific place, it can affect miles of waterways and ocean.
Nonpoint source
Nonpoint source pollution is contamination derived from diffuse sources. These may include agricultural or stormwater runoff or debris blown into waterways from land. Nonpoint source pollution is the leading cause of water pollution in U.S. waters, but it’s difficult to regulate, since there’s no single, identifiable culprit.
Transboundary
It goes without saying that water pollution can’t be contained by a line on a map. Transboundary pollution is the result of contaminated water from one country spilling into the waters of another. Contamination can result from a disaster—like an oil spill—or the slow, downriver creep of industrial, agricultural, or municipal discharge.
What type of water is being impacted?
Groundwater pollution
When rain falls and seeps deep into the earth, filling the cracks, crevices, and porous spaces of an aquifer (basically an underground storehouse of water), it becomes groundwater—one of our least visible but most important natural resources. Nearly 40 percent of Americans rely on groundwater, pumped to the earth’s surface, for drinking water. For some folks in rural areas, it’s their only freshwater source. Groundwater gets polluted when contaminants—from pesticides and fertilizers to waste leached from landfills and septic systems—make their way into an aquifer, rendering it unsafe for human use. Ridding groundwater of contaminants can be difficult to impossible, as well as costly. Once polluted, an aquifer may be unusable for decades, or even thousands of years. Groundwater can also spread contamination far from the original polluting source as it seeps into streams, lakes, and oceans.
Surface water pollution
Covering about 70 percent of the earth, surface water is what fills our oceans, lakes, rivers, and all those other blue bits on the world map. Surface water from freshwater sources (that is, from sources other than the ocean) accounts for more than 60 percent of the water delivered to American homes. But a significant pool of that water is in peril. According to the most recent surveys on national water quality from the U.S. Environmental Protection Agency, nearly half of our rivers and streams and more than one-third of our lakes are polluted and unfit for swimming, fishing, and drinking. Nutrient pollution, which includes nitrates and phosphates, is the leading type of contamination in these freshwater sources. While plants and animals need these nutrients to grow, they have become a major pollutant due to farm waste and fertilizer runoff. Municipal and industrial waste discharges contribute their fair share of toxins as well. There’s also all the random junk that industry and individuals dump directly into waterways.
Ocean water pollution
Eighty percent of ocean pollution (also called marine pollution) originates on land—whether along the coast or far inland. Contaminants such as chemicals, nutrients, and heavy metals are carried from farms, factories, and cities by streams and rivers into our bays and estuaries; from there they travel out to sea. Meanwhile, marine debris—particularly plastic—is blown in by the wind or washed in via storm drains and sewers. Our seas are also sometimes spoiled by oil spills and leaks—big and small—and are consistently soaking up carbon pollution from the air. The ocean absorbs as much as a quarter of man-made carbon emissions.
What are the effects of water pollution?
On human health
To put it bluntly: Water pollution kills. In fact, it caused 1.8 million deaths in 2015, according to a study published in The Lancet. Contaminated water can also make you ill. Every year, unsafe water sickens about 1 billion people. And low-income communities are disproportionately at risk because their homes are often closest to the most polluting industries.
Waterborne pathogens, in the form of disease-causing bacteria and viruses from human and animal waste, are a major cause of illness from contaminated drinking water. Diseases spread by unsafe water include cholera, giardia, and typhoid. Even in wealthy nations, accidental or illegal releases from sewage treatment facilities, as well as runoff from farms and urban areas, contribute harmful pathogens to waterways. Thousands of people across the United States are sickened every year by Legionnaires’ disease (a severe form of pneumonia contracted from water sources like cooling towers and piped water), with cases cropping up from California’s Disneyland to Manhattan’s Upper East Side.
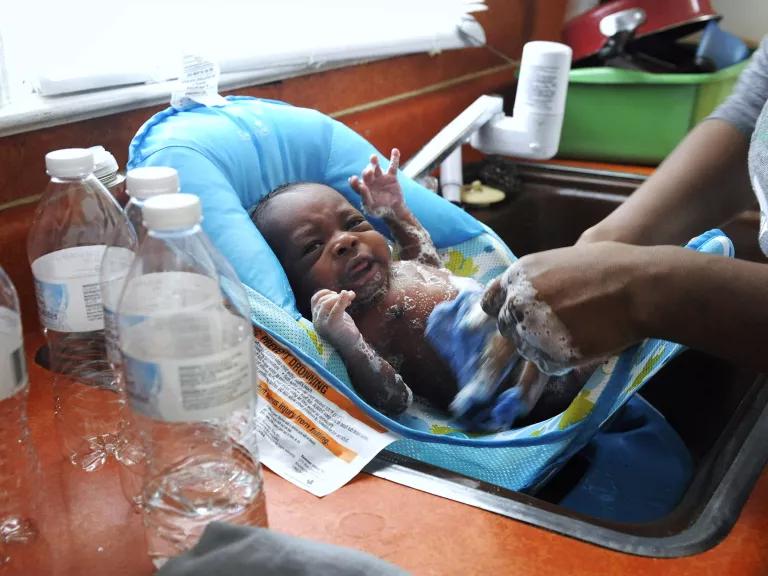
A woman using bottled water to wash her three-week-old son at their home in Flint, Michigan
Todd McInturf/The Detroit News/AP
Meanwhile, the plight of residents in Flint, Michigan—where cost-cutting measures and aging water infrastructure created a lead contamination crisis—offers a stark look at how dangerous chemical and other industrial pollutants in our water can be. The problem goes far beyond Flint and involves much more than lead, as a wide range of chemical pollutants—from heavy metals such as arsenic and mercury to pesticides and nitrate fertilizers—are getting into our water supplies. Once they’re ingested, these toxins can cause a host of health issues, from cancer to hormone disruption to altered brain function. Children and pregnant women are particularly at risk.
Even swimming can pose a risk. Every year, 3.5 million Americans contract health issues such as skin rashes, pinkeye, respiratory infections, and hepatitis from sewage-laden coastal waters, according to EPA estimates.
On the environment
In order to thrive, healthy ecosystems rely on a complex web of animals, plants, bacteria, and fungi—all of which interact, directly or indirectly, with each other. Harm to any of these organisms can create a chain effect, imperiling entire aquatic environments.
When water pollution causes an algal bloom in a lake or marine environment, the proliferation of newly introduced nutrients stimulates plant and algae growth, which in turn reduces oxygen levels in the water. This dearth of oxygen, known as eutrophication, suffocates plants and animals and can create “dead zones,” where waters are essentially devoid of life. In certain cases, these harmful algal blooms can also produce neurotoxins that affect wildlife, from whales to sea turtles.
Chemicals and heavy metals from industrial and municipal wastewater contaminate waterways as well. These contaminants are toxic to aquatic life—most often reducing an organism’s life span and ability to reproduce—and make their way up the food chain as predator eats prey. That’s how tuna and other big fish accumulate high quantities of toxins, such as mercury.
Marine ecosystems are also threatened by marine debris, which can strangle, suffocate, and starve animals. Much of this solid debris, such as plastic bags and soda cans, gets swept into sewers and storm drains and eventually out to sea, turning our oceans into trash soup and sometimes consolidating to form floating garbage patches. Discarded fishing gear and other types of debris are responsible for harming more than 200 different species of marine life.
Meanwhile, ocean acidification is making it tougher for shellfish and coral to survive. Though they absorb about a quarter of the carbon pollution created each year by burning fossil fuels, oceans are becoming more acidic. This process makes it harder for shellfish and other species to build shells and may impact the nervous systems of sharks, clownfish, and other marine life.
What can you do to prevent water pollution?
With your actions
We’re all accountable to some degree for today’s water pollution problem. Fortunately, there are some simple ways you can prevent water contamination or at least limit your contribution to it:
- Learn about the unique qualities of water where you live. Where does your water come from? Is the wastewater from your home treated? Where does stormwater flow to? Is your area in a drought? Start building a picture of the situation so you can discover where your actions will have the most impact—and see if your neighbors would be interested in joining in!
- Reduce your plastic consumption and reuse or recycle plastic when you can.
- Properly dispose of chemical cleaners, oils, and nonbiodegradable items to keep them from going down the drain.
- Maintain your car so it doesn’t leak oil, antifreeze, or coolant.
- If you have a yard, consider landscaping that reduces runoff and avoid applying pesticides and herbicides.
- Don’t flush your old medications! Dispose of them in the trash to prevent them from entering local waterways.
- Be mindful of anything you pour into storm sewers, since that waste often won’t be treated before being released into local waterways. If you notice a storm sewer blocked by litter, clean it up to keep that trash out of the water. (You’ll also help prevent troublesome street floods in a heavy storm.)
- If you have a pup, be sure to pick up its poop.
With your voice
One of the most effective ways to stand up for our waters is to speak out in support of the Clean Water Act, which has helped hold polluters accountable for five decades—despite attempts by destructive industries to gut its authority. But we also need regulations that keep pace with modern-day challenges, including microplastics, PFAS, pharmaceuticals, and other contaminants our wastewater treatment plants weren’t built to handle, not to mention polluted water that’s dumped untreated.
Tell the federal government, the U.S. Army Corps of Engineers, and your local elected officials that you support water protections and investments in infrastructure, like wastewater treatment, lead-pipe removal programs, and stormwater-abating green infrastructure. Also, learn how you and those around you can get involved in the policymaking process. Our public waterways serve every one of us. We should all have a say in how they’re protected.
This story was originally published on May 14, 2018, and has been updated with new information and links.
This NRDC.org story is available for online republication by news media outlets or nonprofits under these conditions: The writer(s) must be credited with a byline; you must note prominently that the story was originally published by NRDC.org and link to the original; the story cannot be edited (beyond simple things such as grammar); you can’t resell the story in any form or grant republishing rights to other outlets; you can’t republish our material wholesale or automatically—you need to select stories individually; you can’t republish the photos or graphics on our site without specific permission; you should drop us a note to let us know when you’ve used one of our stories.
Single-Use Plastics 101
Microplastic Is Inside Your Body
We Are Here to Make a Difference: Our Litigators Are at the Ready