Get Ready for Climate Whiplash from DWR’s February Forecast
The U.S. Bureau of Reclamation hasn’t and DWR need to reconsider the water supply allocations announced to date and limit water allocations to human health and safety until there is more certainty about how much water there will be this year.

While many had hoped that the huge storms in October and December would bring an end to California’s drought, it was always going to take a lot more rain and snow to make up for the deficit after several dry years (as wonderfully illustrated in the fourth graph from this story in the LA Times). But after January’s near-record dry conditions, and the increasing likelihood of dry conditions through mid-February, it’s time to get serious about preparing for a third dry year in 2022. While we can all hope for the best, California needs to prepare for the worst. Unfortunately, the California Department of Water Resources’ (“DWR”) forecasts aren’t helping California prepare how dry this year is likely to be, at least barring a March miracle. As a result, DWR and the U.S. Bureau of Reclamation need to reconsider water supply allocations and hold off on making any additional water supply allocations until it’s clear there is enough water to support those allocations and meet environmental commitments.
DWR’s hydrological forecast from January was unreasonably optimistic after December’s storms, and DWR’s February forecast is going to look much, much grimmer. How much worse? We won’t know for sure until DWR releases the updated forecast on February 8, but I expect that DWR’s conservative (90%) forecast in February will look worse than DWR’s worst-case (99%) forecast in January. And if February is dry (as the models and forecasts are anticipating), the March forecasts will look even worse than this. This may come as a shock for agencies that were making plans based on January’s overly optimistic forecasts from DWR. California needs to get ready for the climate whiplash as the water that was assumed to fill upstream reservoirs in the January forecast has disappeared from the February forecast.
| DWR Jan. 1, 2022 Forecast of Shasta inflow | California Nevada River Forecast Center Jan. 27, 2022 Forecast of Shasta Inflow | |
| 99% Exceedance | 3.550 MAF | N/A |
| 90% Exceedance | 4.155 MAF | 3.086 MAF |
| 75% Exceedance | 4.710 MAF | 3.676 MAF |
| 50% Exceedance | 5.560 MAF | 4.411 MAF |
The table above compares DWR’s January 1st forecast of total runoff into Shasta Reservoir for the water year with the January 27th forecast from the California Nevada River Forecast Center (their forecast is updated daily, and it has been declining as the weather stays dry; for instance, on January 13th, the 90% forecast was 3.324 MAF – still far below DWR’s 99% forecast). DWR’s January 1st forecast (online here) estimated that the total runoff into Shasta Reservoir for the water year would be more than 4.1 million acre feet under the 90% (conservative) forecast and more than 3.5 million acre feet under the 99% (worst case) forecast. In contrast, CNRFC’s 90% forecast estimates less than 3.1 million acre feet of water flowing into Shasta reservoir this year – substantially less than DWR’s 99% forecast from January.
It’s critically important early in the season to use conservative forecasts, because if the forecast is wrong – and while forecasts are helpful, they are almost always wrong to some degree – it’s far better to underestimate how much water there will be, rather than overestimate how much water there will be. Early in the season agencies use the 90% forecast, because it generally means that conditions are anticipated to be wetter than the forecast in 90 years out of 100. Last spring, DWR got those monthly runoff forecasts spectacularly wrong, with DWR’s May forecast of runoff (from April to July) dropping nearly 700,000 acre feet from the April forecast (this reduction in estimated runoff was captured in the weekly updates between early April and early May, but apparently management wasn’t paying attention until the May forecast came out and they were shocked and petitioned the State Water Board to allow them to violate water quality objectives, even as DWR and Reclamation continued to allocate more than 4 million acre feet of water to their contractors).
As DWR noted recently about last year’s erroneous modeling:
California’s climate is transitioning to a warmer setting in which historical relationships among temperature, precipitation, and runoff are changing. It becomes increasingly difficult to rely on historical observations to predict water supply conditions, as was observed this spring when DWR’s snowmelt runoff forecasts substantially over-estimated the runoff that occurred. DWR’s median April 1st runoff forecasts for the Sacramento River Hydrologic Region, San Joaquin River Hydrologic Region, and Tulare Lake Hydrologic Region were overestimated by 68 percent, 45 percent, and 46 percent, respectively.
…
The significant overestimation in DWR’s spring 2021 forecasts of snowmelt runoff forecasts illustrate the importance of shifting away from statistical approaches that rely on a historical record no longer reflective of observed conditions, including the need to invest in the data to support better forecasting.
It seems apparent that these modeling problems at DWR aren’t fixed yet. To be fair, this isn’t an easy problem to fix. State and federal agencies have a long history of relying on the historical hydrologic record to evaluate the present and future, even though – as the TV commercials from finance advisors warn potential investors – “past performance is not a guarantee of future success.” And it is also true that these runoff forecasts are generally less reliable earlier in the winter than they are later in the spring, given California’s variable climate, even before accounting for the reality of climate change. But it also seems clear that DWR’s 90% forecast is not conservative enough, and the agencies probably need to start looking more closely at DWR’s 99% forecast.
While the water year got off to a great start, as of January 28th California’s snowpack is now just below average for this date (as the first graph below shows). But that’s not because all of that snow is melting – in fact, as the second graph below shows, it’s largely because California simply hasn’t gotten more snow since those storms. Because the snowpack traditionally peaks on April 1, and in an average year we get more snow in January through March, the percent of average for this date will continue to decline as long as we don’t get more snow. The two graphs will have identical results on April 1.

It’s important to remember that, as we all should have learned in school, an average grade is a ‘C’ (no grade inflation here!), so results that are below average are a failing grade. On the other hand, because of the reality of climate change, even an “average” snowpack (which is average compared to historical hydrology) sounds great these days.
DWR recently announced increased water supply allocations and are hoping to further increase the allocation. The U.S. Bureau of Reclamation hasn’t yet announced water supply allocations. Given the dry hydrology in January and the increasing likelihood that February will also be very dry, Reclamation and DWR need to reconsider the water supply allocations announced to date and limit water allocations to human health and safety until there is more certainty about how much water there will be this year.
Related Blogs
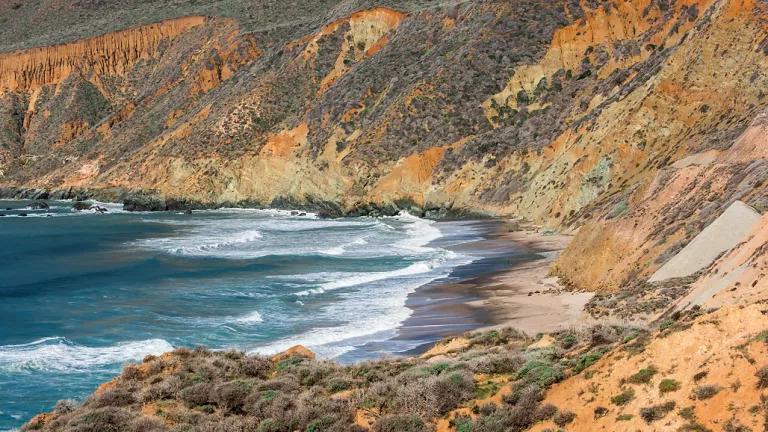
Adaptive Management Should Anchor California’s Ocean Conservation Goals
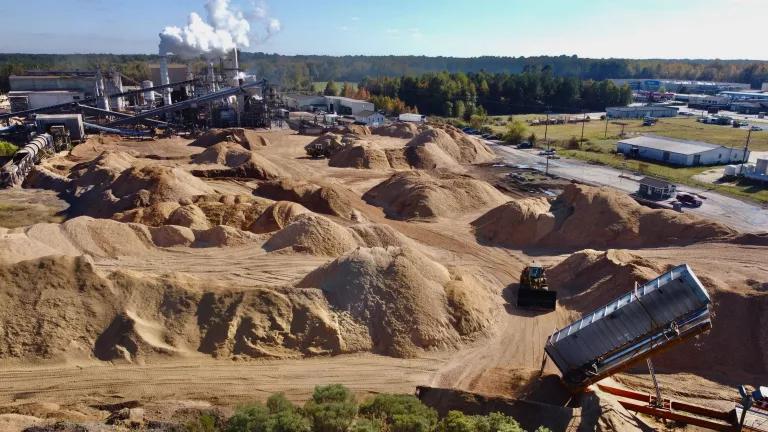
Why Wood Pellets Won’t Solve California’s Wildfire Problem