As big oil and its friends call for more drilling under the false pretense that we can drill our way to lower gasoline prices, it’s worth taking a moment to reflect on the importance of the Energy Information Agency's unbiased data to inform the debate. Thanks to their historical records and energy forecasts, it's clear that driving on electricity is a safer bet than driving on oil.
The EIA is America’s official energy bean-counter. Without EIA data, conversations about energy are reduced to theoretical philosophy. My colleague, Deron Lovaas, recently used EIA data to reveal the simple, hard truth that we can’t drill our way out of this one. Another colleague, Cai Steger, has highlighted the critical role EIA plays in tracking the remarkable growth of renewable energy in this country. Unfortunately, as Cai notes, the EIA’s budget is being slashed.
Previously, I’ve used EIA data contrasting volatile and unpredictable oil prices with relatively stable electricity prices to make the point that choosing to drive on electricity is a safer bet. I recently came across an older EIA chart that deserves some attention as our country decides whether it’s going to continue futile efforts to drill its way to lower gas prices, or invest in real solutions, including more efficient vehicles.
As a history major, I prefer this type of fact-based analysis to the empty logic behind “Drill Baby Drill!” bumper-stickers.
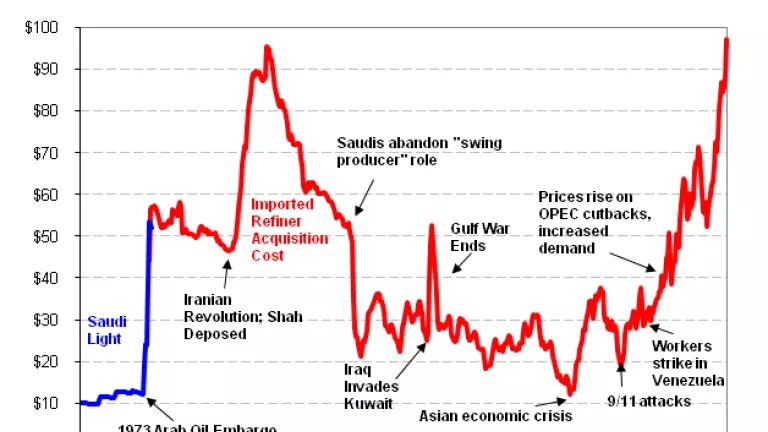
But while this chart clearly displays the correlation between geo-political events beyond our control and the rise and fall of oil prices up to the first quarter of 2008, it is in desparate need of an update. The price of oil collapsed in mid-2008, only to rise again, spurred by ongoing popular revolutions throughout the Arab world. Unfortunately, given EIA’s budget cuts, there’s no guarantee charts like these will updated anytime soon.
While the debate continues on rising gasoline prices, more drilling in wild spaces, and tax breaks for oil companies making record profits, it’s worth rexamining the oil-electricity price comparison using more EIA data. Because EIA provides its spreadsheets to the public, it’s relatively easy to create new charts, as I’ve done here, displaying electricity prices for the same period of history.

From 1970 to 1980, while the price of oil increased 850%, the price of electricity rose 40%. In 1973, oil accounted for 17% of the electricity produced in this country, so there’s a muted correlation between the rising electricity prices in 1970s and the political events during the same time period. However, by 1985, oil accounted for only 4% of U.S. electricity generation, and now it’s around 1% (calculations done using more EIA data).
Electricity is made from a diverse supply of largely domestic fuels, and its price is closely regulated by public utilities commissions. Accordingly, the price of electricity doesn’t care if workers strike in Venezuela or if rebel forces make progress in Libya. When Iraq invaded Kuwait in 1990, the price of oil spiked, and the price of electricity continued a gradual twenty-year decline. While the price of oil increased almost tenfold following the Asian economic crisis in 1997 until its peak in 2008, the price of electricity increased about 12%.
In short, the price of oil reads the morning’s headlines and freaks out, while the price of electricity is blissfully ignorant and kinda boring. Which would you rather depend on to fuel your car?
Leaving history in its proper place, let’s use EIA analysis to examine the future. Starting again with oil, here’s the EIA’s projections for world oil prices, in three different scenarios:

Conclusion: in the low price case, a barrel of oil will cost about as much as it did when prices spiked after Iraq invaded Kuwait, but it might cost four times that amount. Not exactly the type of predictablity you'd want when making a long term investment, say, in a new car.
Let’s look at the EIA forecasts for the price of electricity over the same period:

Looks like the price of electricity isn’t likely to grow out of its boring phase anytime soon. By 2035, the cost of driving on electricity in the high- and low-case forecasts is roughly the difference between driving on $1.15/gallon and $0.98/gallon gasoline. Prices will vary across the country, but on average, driving on electricity for the next twenty or so years is likely to cost somewhere just north of a buck a gallon. Compared to volatile, unregulated oil prices, that’s a pretty safe bet.
Automakers will be introducing 30-40 different plug-in electric vehicles within the next several years. When you buy your next car, try to keep these charts in the back of your mind, and thank the EIA for providing the hard data that makes such comparisons possible.