New Analysis: The Cost of Energy Efficiency is Under Half the Cost of Building Dirty Coal Power Plants
After mining the results of energy efficiency programs representing every U.S. region, Lawrence Berkeley National Laboratory (LBNL) researchers have reported the initial result that the average total cost of saved energy is only 4.4 cents per kilowatt hour. This means that smarter uses of energy can replace dirty coal at a fraction of the cost of building coal plants to generate electricity (and without polluting our air or exacerbating climate disruption).
Because most of us are not energy nerds who think in terms of kilowatt hours, it may help to put this in context. The average rate U.S. utilities charge residential customers is about 13 cents per kilowatt hour. We can also compare this to the U.S. Energy Information Agency (EIA) estimates for the utilities’ cost of buying new resources to make electricity. For example, the EIA estimate for the cost of conventional coal for utilities is 9.5 cents per kilowatt hour – more than double the total cost of saved energy.
Another point of comparison is the Environmental Protection Agency’s (EPA) proposed rule to limit pollution from existing power plants, which offers increased energy efficiency efforts as one option to reduce carbon emissions. The EPA very conservatively estimates that increasing efficiency will cost about double the estimate from LBNL’s new analysis. This means that securing more energy efficiency will likely cost far less than what the EPA is projecting when it sets the state-by-state emission reduction targets under its Clean Power Plan.
The LBNL preliminary analysis, reported this week at a conference for state regulators, provides critical information that can help us make smart choices between energy resources, and identify affordable and reliable options (like energy efficiency) that can reduce emissions from power plants and stave off the worst effects of climate. LBNL’s analysis of the cost of saved energy is the most comprehensive to date. In total, their database includes 5,900 “program years” spanning 2009 to 2013 from over 100 program administrators in 34 states. Importantly, their data includes both states that have been leaders in efficiency for well over 10 years, and those that are just getting started. Across the board, these results show the value of energy efficiency in every region of the country, across climate zones, and in both blue states and red states.
The Cost of Saved Energy by the Numbers
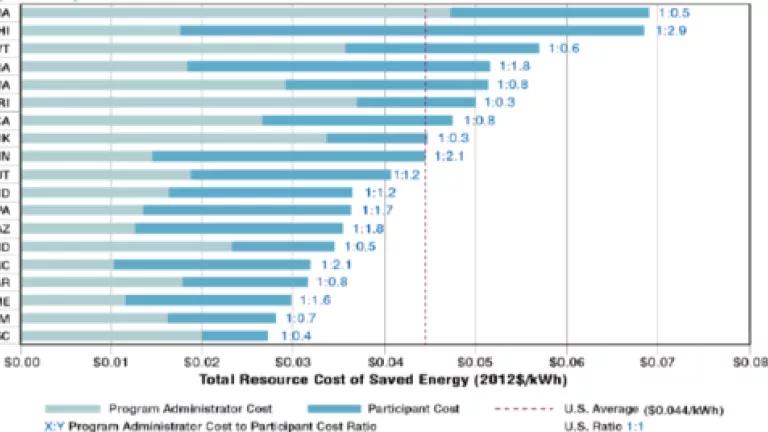
The graphic below compares the cost of saved energy in 19 states, representing every U.S. region.
Source: LBNL DSM Program Database
The “total resource” cost of saved energy includes both the costs of the energy efficiency program administrator (such as a utility company) who might offer an incentive to encourage the adoption of an efficiency measure, and also the direct cost to the participating individual or business. For example, a program to encourage improved insulation in homes might include 1) program administration and marketing costs, 2) a rebate incentive for participants, and 3) the direct costs to participants of adding insulation beyond the rebate amount. Program administrator costs are #1 and #2, and the participant cost is #3.
LBNL researchers found that about half of 100-plus programs administrators in their database reported only their own costs (e.g. their administrative costs and incentives offered to participants). Looking just at the program administrators’ expenses, the cost of saved energy is only about 2.3 cents per kilowatt hour. Adding in participant costs, for the 50 program administrators in 19 states who report that, about doubles the cost to get the 4.4 cents per kilowatt hour. In other words, program participants on average match the spending by the program administrators and they benefit through bill savings.
LBNL’s new analysis is the most comprehensive assessment to date. It digs deep into the (reams) of data from existing programs to calculate the value that energy efficiency has delivered across the country. We have a lot to learn about the performance of specific types of energy efficiency programs over time, and we anticipate additional analysis from this data set over the coming months and years – but these numbers are an important new contribution to making the case for energy efficiency as the cheapest, cleanest resource available to every state in the nation.