There are skeptics of energy efficiency who claim that, paradoxically, all the energy and money we have been saving due to energy efficiency, across all sectors of the economy, has actually caused us to increase our energy consumption. This “economy-wide rebound” theory is a startling, but ultimately unsupportable, theory that is plainly contradicted by the evidence. In a new article published today in the online journal, www.ElectricityPolicy.com (Article), my colleagues and I put this economy-wide rebound theory to the test: we measure it against the data. As my colleague David Goldstein shows in his blog, no scientifically testable version of the theory, including the economy-wide version, is supported by the evidence. Indeed, what emerges is the exact opposite: energy efficiency results typically are understated by conventional accounting. In this blog, I will focus exclusively on the economy-wide rebound theory, looking at how economies can, and do, reduce energy consumption as a portion of GDP.
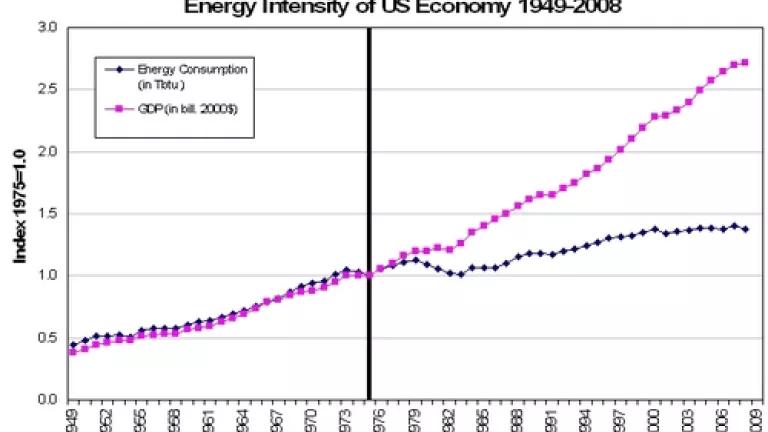
Rebound theory claims that efficiency causes an economy to consume more energy. But more than what? In order to be scientifically testable, the theory must provide a baseline against which it can be tested. After searching for a testable version of the hypothesis, the only one we could identify was: “more than what the economy presently consumes.” That is, rebound theory claims that efficiency causes energy consumption to increase to a higher level compared to the status quo before the efficiency measures were adopted. This version of rebound theory can be tested. Let’s check it against the facts—starting with what our energy consumption looked like before strong energy efficiency policies in America, and then looking at what happened next. If the economy-wide rebound theory were right, we would expect energy consumption to grow more rapidly than the economy. Here are the plain numbers over the last 60 years from the Department of Energy, in real dollars of GDP, along with units of energy consumption, in trillions of Btus (TBtu).[1]
Clearly, rebound theory’s prediction did not pan out. In fact, quite the opposite occurred. Before energy efficiency, in post-World War II America, our energy consumption was increasing in lockstep with production of wealth. However, after the 1970s, around the time that energy efficiency policies became priorities at both national and state levels, this lockstep pattern was broken. Contrary to rebound theory, our economy began to produce more wealth for every unit of energy consumed than it did before. In 1975, the US was producing $60 from each million Btu it consumed (in real 2000 dollars). After significant energy efficiency progress, by 2008, we were producing $119 from the same quantity of energy. This is like squeezing more money from the same barrel of oil. And over the last 35 years, we squeezed nearly twice as much out of it. We are in fact producing more, using less.
While reasonable people might disagree about the extent of efficiency’s impact on the economy, the central tenet of rebound theory is plainly disproven by the facts. The economy-wide rebound theory says that from all sectors of the economy, from all effects, and through all possible mechanisms, the economy will somehow, in the aggregate, increase its consumption relative to the status quo. This did not occur. During 1949 to 1975, our energy intensity was decreasing slightly (about 14%); in the next 26 years, our energy intensity decreased about three times as much, decreasing an additional 41%. Rebound theory did not pan out. This is clear even if you look at energy consumption independently. From 1949-1975, pure energy consumption increased by 125%; in the next 26 years, it would slow to 37%. Any way you look at it, efficiency did not cause the US economy to magically start consuming more energy than it used to.
And this result is not unique to the US. In virtually all the developed countries, economies have been able to break the link between energy consumption and economic growth, showing year upon year decreases in energy intensity. Between 1990 and 2006, Norway and the UK decreased their energy intensity over 2 percent each year; Canada, Germany, Sweden, and the Netherlands decreased over 1.5 percent per year; Australia, Denmark, Finland, France, and New Zealand decreased over 1 percent per year.[2] Not only have these countries made strong reductions in energy intensity, but IEA analysis shows that a significant portion of the reductions are due to energy efficiency—not just general changes in the economy.[3] The plain data show that efficiency is possible and that economies are able to produce more while consuming less.
The fact that energy intensities can improve over time produces a real dilemma for rebound theory: If its proponents refuse to pick a baseline energy intensity, upon which it can be tested, then the theory becomes untestable and not scientific; on the other hand, if they pick a baseline energy intensity (the status quo), then it proves rebound effects do not occur at the economy-wide level. Thus, rebound theory is at best an unscientific exercise in ideological posturing, or at worst, a proven failure. Economies can and do break the link between energy consumption and economic growth, based in substantial part on energy efficiency measures.
[1] US Department of Energy, Energy Intensity Indicators in the U.S., Economy-wide Total Energy Consumption (May 2008). Available at: http://www1.eere.energy.gov/ba/pba/intensityindicators/trend_data.html…; For data from 2005-2008: US Department of Energy, State Energy Database System Consumption, British Thermal Units, 1960–2008, (June 2010) (Growth in post-2004 years normalized to May 2008 data in order to maintain consistency across data sources). Available at: http://www.eia.doe.gov/states/_seds.html.
[2] On average, between 1996 and 2008, these OECD countries decreased their energy intensity about 1.6 percent per year. International Energy Agency, Implementing Energy Efficiency Policies, Figure 45: Decomposition of Final Energy Intensity Changes in IEA17 Countries, 1990-2006 (2009). Available at: http://www.iea.org/textbase/nppdf/free/2009/implementingee2009.pdf.
[3] International Energy Agency, Implementing Energy Efficiency Policies, Figure 45: Decomposition of Final Energy Intensity Changes in IEA17 Countries, 1990-2006 (2009).