
2035 National Climate Plan Benchmarks for Major Economies
A summary of emission reduction benchmarks as G20 countries begin to set their national 2035 climate targets under the Paris Agreement.
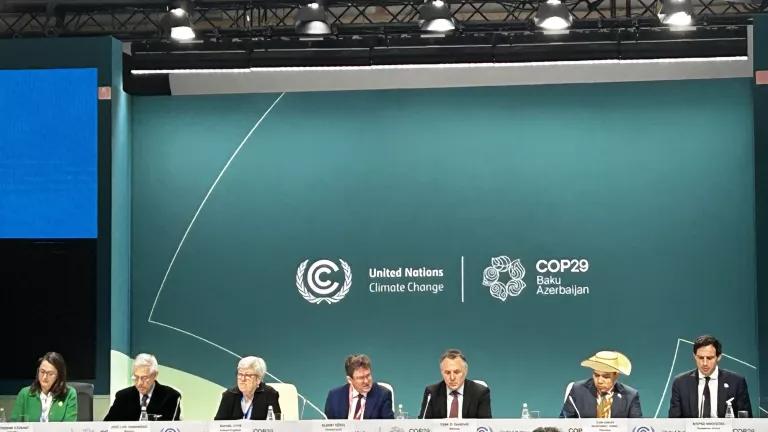
Leaders from the UK, EU, Panama, Mexico, Canada, Switzerland, and Norway announcing direction on their 2035 national climate targets during the COP29 meeting in Baku.
Jake Schmidt, NRDC


The Paris Agreement sets a deadline for all countries to set new national climate targets—also known as nationally determined contributions (NDCs)—every five years. In 2025, countries will set their 2035 NDCs. The ambition of these NDCs will be critical in determining if the world has a chance of keeping warming below 1.5°C and achieving the global net zero by 2050 goals set in the Paris Agreement.
The next round of NDCs will need to evolve in at least four ways:
- 1.5°C-aligned economy-wide absolute targets including all greenhouse gas (GHG) emissions and land-use change and forestry emissions
- Sectoral targets for key sectors, sub-sectors, and gases (e.g., responsive to the key global targets agreed in the UAE Consensus)
- Details on how other non-mitigation areas support a just transition to a resilient and decarbonized society (e.g. adaptation, including the nexus of climate and nature, climate and health, and the adaptation and loss and damage efforts)
- The justice elements that acknowledge the need for a whole of society approach that leaves no one behind. These NDCs will also need to include elements on adaptation and finance as outlined by several groups in “ten tests” that will make or break 1.5°C.
This post digs deeper into the first part: national 1.5°C-aligned economy-wide absolute targets. We summarize emission reduction benchmarks across six different analysis types that have been published or widely discussed as countries begin to evaluate what level of economy-wide targets they set for 2035, and the global community assesses whether these proposed NDCs are “strong enough” to keep 1.5°C alive. We will include additional analyses as they become publicly available.
We provide 2035 benchmarks for the G20 economies—that, together, account for more than 80 percent of the world’s emissions—across each of these six analyses. For each of the analyses, we show countries in two categories, since the formulation varies by country grouping: (1) countries that have peaked emissions and (2) countries that haven’t peaked emissions.[i], [ii] (For a detailed breakdown of the data for each of the scenarios see here.) The tables in this post show some illustrative variations for each benchmark and include a comparison to a set of standard base years (e.g., 1990, 2005, 2019).[iii]
Read the methodology behind the numbers
Straight line to net zero
In the Paris Agreement, countries agreed to achieve global net zero “in the second half of this century.” As a result, most countries in the world have set a target date for achieving net zero for their emissions. The end date for achieving net zero matters, so we have outlined different net zero dates for countries based upon: (1) for countries that have peaked, net zero in 2050 or 2045 and (2) for countries that haven’t peaked, net zero for 2050, 2060, or 2070.
It also matters when the decline begins, so we have analyzed the decline: (1) for countries that have peaked, starting in 1990, 2005 or 2015 and (2) for countries that haven’t peaked starting in 2025 and 2030. For each country, we include all greenhouse gas emissions across the economy and sequestration from LUCF (see methodology).
Table 1 shows 2035 percent reductions in emissions for the straight line to net zero trajectories in G20 countries that have peaked emissions.
Table 2 shows the 2035 percent reductions in emissions for the straight line to net zero trajectories in G20 countries that haven’t peaked emissions using those variations.
The Rhodium Group conducted an analysis that modeled estimated trajectories for each of the G20 countries under a range of potential economic and market conditions. It analyzed a scenario in which countries meet their 2030 NDCs, and it then assessed a straight-line path from 2030 NDCs to the countries’ mid-century targets.
Table 3 shows 2035 percent reductions in emissions for the Rhodium Group analysis of a straight-line to mid-century targets in G20 countries that have peaked emissions.
Table 4 shows the 2035 percent reductions in emissions for the Rhodium Group analysis of straight-line to mid-century targets in G20 countries that haven’t peaked emissions.
IPCC 1.5°C scenarios
The models that feed into the Intergovernmental Panel on Climate Change (IPCC) assessments include country-by-country breakdowns for many of the world’s largest economies. These models use a “least-cost pathway,” meaning that they find the cheapest pathway to meet the 1.5°C trajectory using the assumptions in their model by country/region. The modeling that feeds into the IPCC assessments includes various 1.5°C pathways. In this blog, we show the median level for each country (see methodology).[xii]
Table 5 shows the 2035 percent reductions in emissions for the IPCC trajectories in G20 countries that have peaked emissions.
Table 6 shows the 2035 percent reductions in emissions for IPCC trajectories in G20 countries that haven’t peaked emissions.
Climate analytics 1.5°C-aligned pathway
Climate Analytics, a leading climate science group, has analyzed country-by-country scenarios for several countries. It uses the “least-cost pathways” from the IPCC scenario, with modifications (as explained in its methodology). These values don’t currently include emissions from LUCF, so we have included an assumption about LUCF (see methodology).[xiv]
Table 7 shows the 2035 percent reductions in emissions for the Climate Analytics trajectories in G20 countries that have peaked emissions.
Table 8 shows the 2035 percent reductions in emissions for the Climate Analytics trajectories in G20 countries that haven’t peaked emissions.
Climate action tracker “1.5°C Paris Agreement compatible”
Climate Action Tracker—a consortium of NewClimate Institute and Climate Analytics—has assessed for key countries its current policies, planned actions, and NDCs against a “fair share” set of metrics (as explained in its “fair share” methodology page).
These values don’t include emissions from LUCF, so we have included an assumption about LUCF. Climate Action Tracker recently released analysis for several countries that includes LUCF. This update doesn’t include all G20 countries and uses a different methodology for including LUCF than we used, so they are included in the detailed spreadsheet but not shown below.
Table 9 shows the 2035 percent reductions in emissions for the Climate Action Tracker trajectories in G20 countries that have peaked emissions.
Table 10 shows the 2035 percent reductions in emissions for the Climate Action Tracker trajectories in G20 countries that haven’t peaked emissions.
Equity-based analysis
The Civil Society Equity Reviews (CSER) and the Climate Equity Reference Project (CERP) assess country “fair shares” using measures of equity. CERP seeks to reflect the international climate agreements “core equity principles.” It uses a responsibility and capability Index to reflect the responsibility of countries to climate change combined with their capability to cut emissions.
Several coalitions have used this tool to assess 2035 national NDCs including for the United States, Canada, European Union, and Brazil. Since updated 2035 NDC assessments using the CERP methodology aren’t currently available for all G20 countries, we haven’t included a detailed breakout. CSER didn’t currently provide information for all G20 countries, so they weren’t included in the detailed breakout.
National bottom-up assessments
Researchers in countries and external experts have conducted various bottom-up national assessments over the years that often evaluate a version of a 1.5/2°C consistent trajectory for that country, pathways consistent with the countries’ net zero target, 2035 emissions level based upon a combination of national policies, or some combination. These can include the kinds of subnational actions (e.g., from states/provinces, cities, companies, investors) that have become a core component of the actions that help deliver national-level emissions reductions. Since national bottom-up analyses aren’t publicly available for all G20 countries and can vary based upon formulations (e.g., different assumed climate trajectories between countries), we haven’t included a detailed breakout.
A recent analysis from the Center for Global Sustainability conducts a bottom-up analysis for the G20 with in-depth assessments for 10 countries: Australia, Brazil, Canada, China, India, Indonesia, Japan, Mexico, South Africa, and South Korea. It applies a common framework—it labels the “high ambition” country pathways—for each of these countries. While some show similar findings to the various top-down analysis presented above, several countries—for example, China and India—result in smaller reductions when aligning near-term trends in country contexts.
Table 11 shows the 2035 percent reductions in emissions for the Center for Global Sustainability trajectories in G20 countries that have peaked emissions.
Table 12 shows the Climate Analytics results for countries that haven’t peaked emissions using those variations.
Aligning NDCs with 1.5°C
To be credible, the individual and collective 2030, 2035, and net zero trajectories will need to be consistent with holding temperatures to below 1.5°C above pre-industrial levels as countries agreed under the Paris Agreement. Each of the formulations discussed above have pros and cons in terms of their consistency with this global 1.5°C benchmark. Researchers at WRI have looked at the characteristics and challenges in assessing “alignment” of NDCs the collective 1.5°C goal. They conclude that a “binary categorization of NDCs into those that do and do not align with a given objective may be less useful than a more nuanced and multidimensional view.”
This post hopes to help facilitate the assessment as countries begin to announce their next iteration of NDCs by helping to navigate the different sources of information that can be used to promote accountability in determining whether the next round of NDCs are “strong enough” to keep 1.5°C alive.
Some countries have begun to announce NDCs (e.g., the United Kingdom, Brazil, United Arab Emirates, Canada, Japan), which can be assessed against these benchmarks as the world seeks to create a race to the top in the level of ambition reflected in the next round of NDCs.
And a group of countries—the European Union, Mexico, Chile, United Kingdom, Canada, Bhutan, Madagascar, Panama, Suriname, Switzerland, Norway, and Georgia—announced that they would commit to 2035 targets that are at least on a straight line to their net zero targets.
This blog was originally published December 3, 2024, and has been updated with new information and links. Subsequent posts will summarize the proposed NDCs against these various benchmarks.
[i] “Countries that have peaked” are ones where total historic economy-wide emissions for the country have reached a peak. “Countries that haven’t peaked” are ones where historic data doesn’t yet show a peak in their total economy-wide emissions.
[ii] Recent data for some countries in the second category—“countries that haven’t peaked”—has found that these countries may have peaked emissions. For example, the UNEP Gap Report 2024 (Figure 3.2) assesses that emissions for Brazil, South Africa, and Argentina have peaked. Some analysis for China has outlined that their emissions have peaked (see: CREA, Rhodium Group). Note, Argentina’s emissions peaked in 2007 but we included them in this category given that CAT assesses that their emissions will grow through 2030 under the “policies and actions” and “Unconditional NDC” scenarios. South Korea’s First Biennial Transparency Report has shown that its emissions peaked in 2018, but we have included them in this second category given the recent nature of that peak and since CAT assesses that emissions will remain relatively flat through 2025 with the current “policies and actions” scenario.
[iii] For each of the data in the table we also show in (parenthesis) the comparison to the base year or value the country uses for its current NDC or is being used in their discussions.
Related Blogs

U.S. 2035 Climate Target Is Ambitious, Achievable & a Call to Action

Driving Ambition, Action, and Equity at COP28 (Part 1)
