Now Is the Time to Get Transportation Right
With record amounts of federal funding for transportation projects underway, a new NRDC scorecard ranks the states on their transportation priorities.
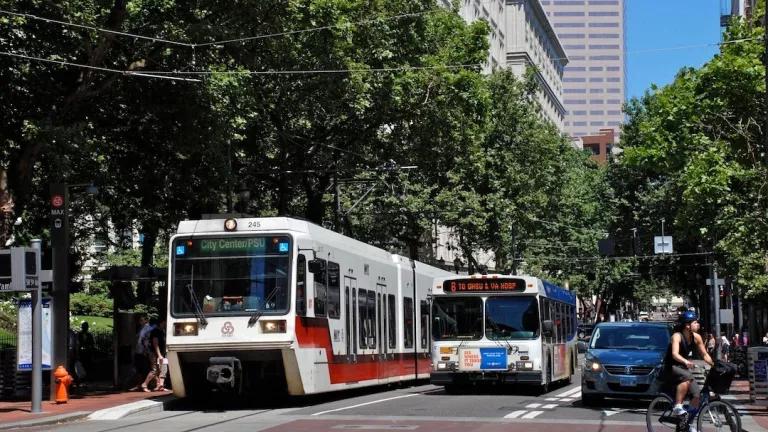
A cyclist riding past a TriMet MAX light rail train and bus in Portland, Oregon
NACTO via Flickr, CC BY-NC 4.0
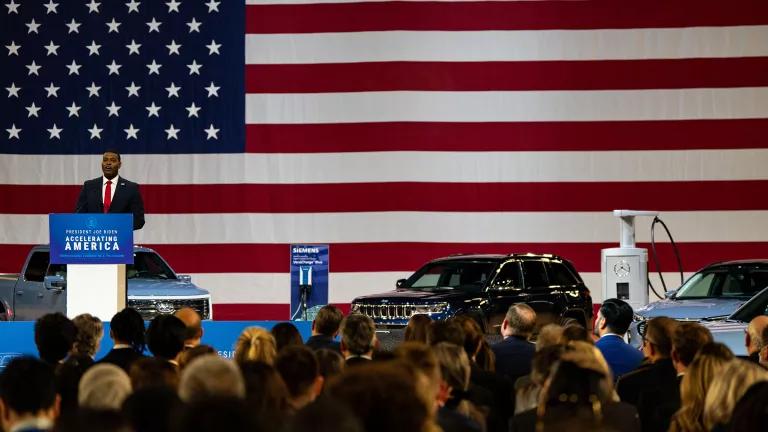
President Biden signed the Bipartisan Infrastructure Law on November 15, 2021. Since then, billions of dollars have been spent and thousands of ribbons have been cut for roads, rails, bridges, chargers, and trails across the country.
But the law's overall impact should not be judged solely on the amount of money allocated. It is a unique, once-in-a-generation opportunity to use infrastructure investments to meet our nation’s climate and equity goals. We need investments that move people to opportunity, reconnect communities, and decarbonize the transportation sector. A new NRDC publication, Getting Transportation Right: Ranking the States in Light of New Federal Funding, ranks the states by how well they are set up to spend those transportation funds.
Read the Report

While the federal government writes the checks, the states are in the driver’s seat for the real decisions of where and how the funds are spent. To shed light on how states are spending that money, NRDC evaluated all 50 states to gauge the general policy and spending context that will influence this federal funding, aiming to identify the degree to which states have adopted policies and directed dollars to improve equity, public heath, and climate outcomes.
In recent years, the transportation sector has surpassed the electric power sector to become the largest contributor to U.S. greenhouse gas emissions. Climate change goals cannot be met without making considerable progress on reducing emissions from the transportation sector. Additionally, where and how state departments of transportation (DOTs) make investments have enormous consequences for people’s ability to access employment, education, health care, and other basic needs. Transportation decisions also have direct impacts on public health; for instance, living close to major roadways has been associated with increased risks of coronary mortality, respiratory disease, and neurological impacts. The history of highway construction dividing low-income communities provides further motivation for ensuring that equity is embedded in all state transportation policy and spending.
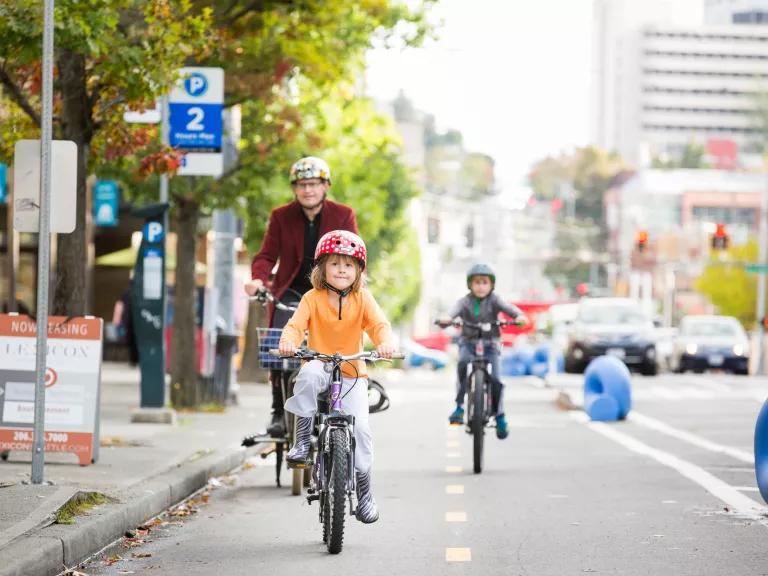
A family rides their bikes in a dedicated bike lane on Broadway in Seattle, Washington
Adam Coppola Photography
What the Scorecard Shows
In this scorecard report, NRDC and David Gardiner and Associates (DGA) assessed states across a range of metrics related to state planning for climate and equity, vehicle electrification, expansion of transportation choices, system maintenance, and procurement. NRDC and DGA drew data from various databases and from state websites to assemble this robust scorecard. Activities that are typically analyzed separately—such as procurement practices, emissions reduction goals, and road maintenance—have been compiled here into a single scorecard to encourage states to take a comprehensive look at their delivery of sustainable and equitable transportation across multiple programs and agencies.
For instance, the “State Planning for Climate and Equity” category includes traditional metrics such as a near-term greenhouse gas reduction goal for the transportation sector but also:
- Equity as part of publicly available state transportation project scoring criteria
- Encouragement in the state DOT’s public participation plan for compensation of community-based organizations or community members for participation in planning processes.
A variety of other metrics were used in the scorecard on a range of issues, including:
- Electric vehicle rebates or grants for low-income buyers
- Dollars flexed to transit and bicycle/pedestrian spending compared with spending on highways
- Achievement of disadvantaged business enterprise (DBE) goals for federally funded transportation projects
- Carbon intensity ceilings for commonly used construction materials in public transportation projects
The Scorecard goes into considerable detail about each of the 22 metrics. For example, 19 states have adopted near-term targets or specific projections for reducing greenhouse gas emissions from transportation. These targets serve as a yardstick by which states can measure the climate impacts of their policy, program, and spending decisions. Also, seven states have adopted both Advanced Clean Cars and Clean Trucks rules, demonstrating a strong commitment to transitioning the fleet to zero-tailpipe emission vehicles. In addition to policy-setting actions, the scorecard also evaluates state spending on a range of items, such as investment in public transit and bicycle/pedestrian facilities.
Taking action on the adoption of these policies and investment priorities is the most effective way for states to bring up their score for next year’s scorecard. This year’s results show that the landscape into which federal funds will be invested is decidedly mixed. While some states have already adopted policies and programs conducive to meeting equity and climate goals, other states must rapidly realign their priorities in order to achieve these outcomes. Even the states currently leading the pack, while they are to be commended for their actions thus far, have areas in need of improvement.
No Time to Waste
The stakes are high; transportation is currently the largest source of greenhouse gas emissions in the United States. Analyses show that this unprecedented new funding could significantly help—or hinder—the shift to a climate-friendly and equitable transportation system, depending on how and where the money is spent. But inertia is not our friend. The grooves of transportation spending at the state level are well worn, and equity and decarbonization have not been the top priorities. We hope this scorecard provides a road map for states to think creatively and proactively about the path ahead.
Related Blogs

Trump’s EPA Declares It’s “Futile” to Fight Climate Change

EPA's Climate Denial Puts Americans in Danger