Image by musiking from Pixabay
Co-authored with Yvette Jordan
It is understood that water is life. It’s the purest form of nature’s essential presence in our lives.
Water baptizes us.
Water renews us.
Water nourishes us.
What happens when the purity of our water is compromised? Society, as we know it, begins to break down. Everyone, every living creature, is affected.
What happens if you add a viral pandemic on top of contaminated water? Basic survival is threatened.
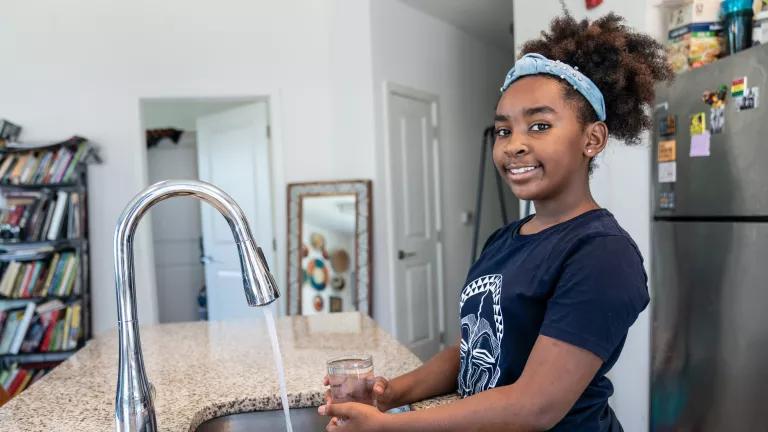
Access to clean water is always essential but is especially crucial during a public health crisis. Thorough and frequent handwashing is the first line of defense against pathogens. If one falls ill, hydration is key. Washing your clothes and keeping surfaces clean are protective salves against a viral invader. Clean water is vital to protecting ourselves, our families, and our communities.
For people in areas with heightened levels of water contamination, though, this relationship is greatly compromised. When you can’t trust the water that comes out of your tap, it can become extremely challenging to keep healthy. How can people safely and constantly venture out to find bottled water, or find and maintain filters for their water when they are struggling to social distance themselves? How can a person who has lost their primary source of income meet the challenge of buying bottled water or filtering their water continuously?
The COVID crisis has placed even greater emphasis on the environmental injustice that is pervasive in many communities. When noxious air, polluted soil, and/or poisoned water mix with COVID-19, the compounded cost can be greater than just a sum of its parts. In this blogpost, we discuss the impact that lead can have on communities and identify areas in the U.S. were lead-contaminated water and COVID-19 meet.
America’s Lead Problem
As an educator and a public health scientist, we know all too well that no amount of lead is safe. None. Even very small amounts of lead—even levels once thought to be safe—can alter a child’s brain and body. The impact of lead can be seen in our nation’s classrooms and in the health outcomes of entire communities. Lead can rob a community of economic potential, increase the need for social and educational services, and severely impact the ability of a community to grow and thrive.
Almost two years ago, an analysis by NRDC found that nearly 30 million people in the United States drank water from community water systems that violated the federal drinking water law between January 2015 and March 2018. It also found that 5.5 million people received their drinking water from systems that had levels of lead that exceeded EPA’s Lead Action Level—a level of lead that requires water systems to take immediate steps to reduce the amount of lead in the water.
Additional analysis revealed that lead-related violations were not equally distributed across populations. Startlingly, the analysis found that in Puerto Rico before the devastating effects of Hurricane Maria, 97.2 percent of the archipelago’s population was served by systems with violations of the Lead and Copper Rule—the largest percentage of a population of any state or territory in the nation. Virtually all of these violations were for improper monitoring or reporting, suggesting that there could be widespread lead exposures that are going undetected or unreported to the public.
Lead in Drinking Water and COVID-19 by the Numbers
Using data from the Environmental Protection Agency’s Enforcement and Compliance History Online (ECHO) database, we identified nearly 2,000 community water systems with at least one action level exceedance for lead between January 1, 2015 and December 31, 2019. These water systems served over 10 million people.
The top five states with the largest percentage of their populations served by systems with action level exceedances were Rhode Island (31 percent), Oregon (29 percent), New Jersey (22 percent), Georgia (13 percent), and Massachusetts (8 percent).
Using data from the Johns Hopkins University Center for Systems Science and Engineering, we calculated 1.6 million COVID-19 cases and 97,000 deaths as of May 25, 2020. The top five states with the highest rates of cases per 100,000 people were New Jersey (1,744 cases per 100,000 people), New York (1,387 cases per 100,000 people), Massachusetts (1,348 cases per 100,000 people), Rhode Island (1,184 cases per 100,000 people), and Washington, D.C. (1165 cases per 100,000 people). The top five states with the highest death rates per 100,000 people were New Jersey (125 deaths per 100,000 people), New York (112 deaths per 100,000 people), Connecticut (105 deaths per 100,000 people), Massachusetts (93 deaths per 100,000 people), and Washington, D.C. (62 deaths per 100,000 people).
While clearly there are many counties with elevated COVID-19 cases and deaths that also may have elevated levels of lead in their drinking water based on available data, there are certain cities, such as Flint and Newark, where high levels of lead in the tap water have been well documented and which overlap with a deeply worrisome elevated rates of COVID-19 cases and deaths. These communities are especially hard-hit and deserve special attention with major investments in providing alternative safe water sources, strong public outreach and education about the risks, and strong ongoing efforts to replace lead service lines as quickly as possible.
Methods-At-A-Glance
To identify the percentage of the population served by systems with action level exceedances, we aggregated the system-level data from ECHO at the county level and calculated the total population served by community water systems. We then divided the populations served by systems with ALEs by the population served by all CWSs in the system.
To identify communities in which lead in drinking water and COVID-19 may be overlapping, we overlaid the COVID-19 quartile data (i.e., quartiles of death rates and case rates) with counties in which at least one system had at least one action level exceedance in between January 1, 2015 and December 31, 2019).
Data Limitations
It should be noted that while our analysis mapped associations between COVID-19 outcomes (i.e. cases and deaths per 100,000 people) and lead in drinking water, the data used in this assessment have several limitations. First, the ECHO database, while robust, is not a perfect representation of drinking water issues communities could be facing. For example, an EPA data audit released in 2008 (the most recent audit available) found that 92 percent of Lead and Copper Rule treatment violations known to states were not reported in the EPA violations database that we used. As Cynthia Giles, the former head of EPA’s enforcement office said in testimony in March 2020, “Repeated audits of state files show that states are not telling EPA about violations. The problem is bad for all drinking water rules but the worst by far is the lead rule.” This could result in our analysis missing some communities with significant health burdens from both lead in drinking water and COVID-19. Second, the COVID-19 case and death data utilized in this visualization is rapidly changing and can vary significantly in quality from location to location. This makes state-by-state comparisons potentially difficult. Finally, while our visualization was performed at the county level due to data availability issues, drinking water systems are not defined by county boundaries. It is possible that populations facing poor COVID-19 outcomes may not fully overlap with populations facing lead-related drinking water issues.
Safe Drinking Water Is Essential at all Times
No community should have to shoulder the burden of lead contaminated water while simultaneously carrying the weight of COVID-19. In developing COVID-19 responses and programs, decision makers at all levels should ensure that access to the elements necessary for life – water, food, and air—are protected and ensured. Communities facing long-standing injustices that may heighten the impacts of COVID-19 should be identified, engaged, and supported throughout this time – with access to clean, safe water as one of the highest priorities.
Exploring the data
Use the following interactive maps to explore county-level data on the locations where we found systems with action level exceedances and the areas of the country where COVID-19 and action level exceedances overlap.
Yvette Jordan is a high school History teacher for the Newark Public Schools in NJ and an Activist for environmental and social justice. Yvette is a founding member of Newark Education Workers Caucus (NEW Caucus), a group of educators committed to fighting for social justice issues within education. A New York City native, Jordan lives in Newark, NJ with her husband. www.yvettejordan.co


