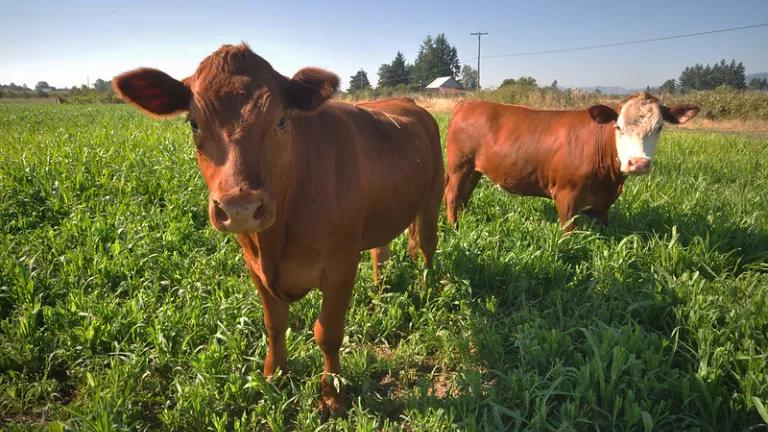
Cows grazing cover crops in Oregon. USDA-NRCS
Every five years, the Census of Agriculture provides a snapshot of US farming, from farmer demographics and farm size, to crops planted, to management practices that farmers use. USDA recently made the 2022 Census data public and there is a wealth of information in it for policy makers and agriculture professionals.
The Census has only been tracking cover crops since 2012, so 2022 marks the third comprehensive, national data on US cover crop adoption. Here is what the numbers tell us, and the questions raised.
Total Cover Crop Adoption Increased to 18 Million Acres
From 2017 to 2022, total acres of cover crops planted from 15.4 million to 18.0 million acres – a 17% increase. Approximately three million acres of additional cover crops is good news; cover crops prevent soil erosion, promote biodiversity, protect water quality, make farmers more resilient to risk from drought and flood, and sequester carbon to help fight climate change.
The New Top 10 States for Cover Crops
In ten states, farmers planted over 750,000 acres of cover crops each; Texas and Iowa farmers planted more than a million. See the top 10 list below and my blog from the 2017 Census for comparison. North Dakota, Kansas, and Minnesota rose into the top 10, Ohio, Michigan, and Pennsylvania dropped down from the top but were close behind and all three states still increased their total cover crop acreage in 2022.
| State | Acres of Cover Crops | Increase from 2017 |
| Texas | 1,550,789 | 53% |
| Iowa | 1,282,608 | 33% |
| Indiana | 988,282 | 6% |
| Nebraska | 925,686 | 24% |
| Missouri | 921,222 | 9% |
| Illinois | 881,228 | 25% |
| North Dakota | 838,252 | 107% |
| Kansas | 767,603 | 38% |
| Minnesota | 760,423 | 31% |
| Wisconsin | 753,926 | 24% |
Comparing Growth: 2012-2017 vs 2017-2022
The news about cover crops is positive overall, but I can’t help but compare the growth between the two Census periods for which we have data; in the last Census, cover crop acreage increased by 5 million acres of 50%. Why did growth seem to slow down somewhat, and did it really? I had the opportunity to discuss these issues at the Midwest Cover Crop Council annual meeting in Indianapolis this past week. Among others, I spoke with Dr. Rob Myers (who is quoted in this Agri-Pulse Census coverage) about the differences and our conversations prompted a few thoughts about the difference and questions to explore.
First, total harvested cropland in 2022 was lower than 2017, by nearly 20 million acres (see Table 9 of the Census executive summary). Putting aside the broader implications for agriculture and the environment, this would mean there are fewer acres that theoretically could have been planted in cover crops that year. Second, there were some states that did not increase their cover crop acreage and this could reflect more winter wheat acres and/or dry weather conditions that lead to reduced cover crop planting. These states are a good starting place to explore. Finally, growth is rarely a straight trajectory, and 2022 may have been a bad year. As climate change continues to impact farm management decisions, we will need policy solutions, research, and technical assistance to address the challenges farmers face. The Census data is a good place to start looking for any needed adjustment or adaptation to strategies to increase soil health practice adoption.
In the meantime, NRDC will continue to support policies that help cover crop farmers manage risk and offset costs of soil health practices like cover crops, including state and federal good stewardship discounts on crop insurance for farmers.
Related Blogs
How Neonics Harm Earthworms

How Management Affects Carbon Stored in Forest Soils
