
Taylor Glascock for NRDC
In every community, there are people—often many people—who chronically struggle to afford their water and sewer bills and face severe consequences, including disconnection of water service. Many studies, both state-specific and national in scope, have confirmed this, with one recent study finding that “[water] affordability concerns are correlated with race after conditioning on poverty levels.”
When it comes to affordability, local water rates matter a lot. Rates are set individually for each of tens of thousands of water systems across the country. These rates, in combination with a customer’s usage and sometimes other factors, determine customers’ bills.
A household’s ability to afford their water bill depends, in turn, on the size of the bill and the household’s income.
It’s well known that residential water bills vary widely across cities around the country. A new peer reviewed paper, published last month, goes further. It explores variation in water rates and looks for patterns that may explain the variation. And it suggests lessons that can help address water affordability challenges. Many of those lessons lend support to solutions explored in the Water Affordability Advocacy Toolkit, which NRDC and National Consumer Law Center published last year.
The study finds incredibly wide variation in bills within states, and even within metropolitan areas. It also identifies several factors that correlate to higher or lower bills, including rate structure, system size, and system ownership. (An original version of the paper, which was commissioned by NRDC, presents the same analysis in a way that may be easier for non-academic readers to digest.)*
This paper differs from other recent analyses in several ways. Most studies focus on large systems or small geographies or use very limited data. This study examines bills across nearly all systems in four regionally diverse states where the most extensive data are available. (These are Arizona, Wisconsin, Georgia, and New Hampshire, totaling over 1,500 water systems). Additionally, many comparative studies focus on whether bills exceed some threshold for affordability, based on household income levels within a community. Instead, this study zeroes in on drivers of disparities in the bills themselves.
The focus on bills allows for identification of water rates that are outliers at the low end and the high end. As the authors noted, “substantial disparities at local levels [can] raise concerns regarding both environmental and social justice and the financial sustainability of water systems.”
Moreover, bills well above average may indicate affordability concerns that—unlike poverty itself—could be addressed through changes in water policy at the local, state, and federal levels.
The paper’s findings offer support for these policies to help address household-level affordability:
- Restructure local water rates to incorporate “lifeline” rates and inclining block rates. (We believe this approach is best coupled with income-based rates for low-income households, although the latter is beyond the scope of the study.)
- Design state or federal low-income water affordability or assistance programs to account for the huge variability in local water bills.
- In appropriate cases and with robust community engagement and buy-in, consider consolidating small water systems.
- When privatization of a publicly owned water system is under consideration, ensure a careful consideration of impacts on water bill affordability.
- Consider how greater state oversight of local water rates could contribute to greater equity in water bills across communities.
- Use the size of local water bills to help prioritize communities for receipt of state and federal financial and technical assistance.
- Create state and/or federal systems to regularly collect standardized data on water rates and bills.
Read on for more details on the study’s findings and policy implications.
What did the study find?
First, although statewide median water and sewer bills were remarkably similar across the four states, bills varied extremely widely within states and even within metropolitan areas.
Within each state, median monthly expenditures for a basic level of water usage were in the range of $23-33 for water and $27-37 for wastewater. That similarity, however, belies a wide variation among utilities. For example, across the entire dataset, the lowest monthly water bill is $2 while the highest is more than $108.**
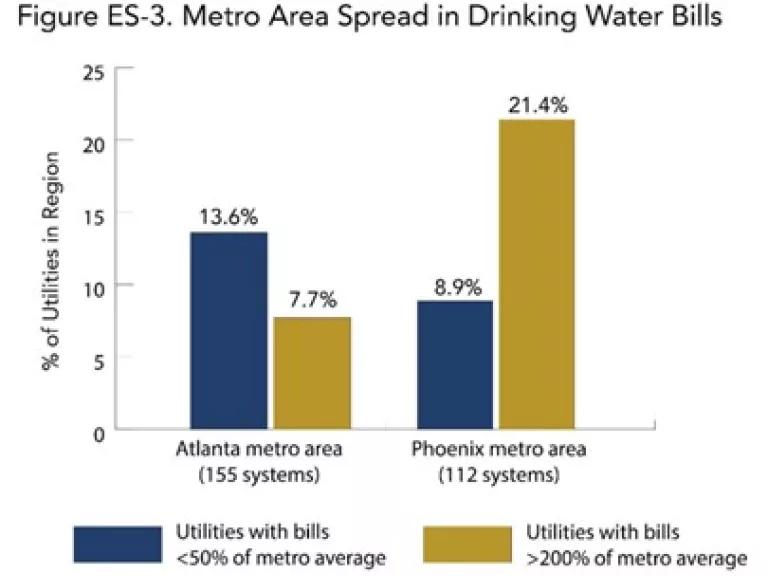
And it’s not just a few outliers. In three of the four states, a significant percentage of systems have bills that are either less than half or more than double the average in their metro areas. (See the figure below.) Wisconsin displayed much less variation; it’s likely no coincidence that Wisconsin is the only state where the state utility commission regulates water rates for all systems.

To illustrate the extreme variation at a local level, the paper highlights Phoenix and Atlanta as examples. (See the figure below.) Across the 112 water systems in the Phoenix metro area, the monthly bill for essential water use ranges from $5 to $82. More than one in five systems (21.4%) charge more than double the metro-wide average, while about one in ten (8.9%) charge less than half of the metro-wide average. In the Atlanta metro area, the monthly bills across 155 water systems have a very similar range to Phoenix (from $2 to $81). But, in Atlanta, only 7.7% of systems charge more than double the metro-wide average, while 14% charge less than half the metro-wide average.
Second, the study identified several statistically significant correlations between water bills and various factors—at least in the four states examined. In short, these are the key takeaways to keep in mind:
- Rate structure matters: Including a baseline amount of water use in a fixed charge, as well as using an inclining block rate structure, correlated with lower bills. (Read on for more explanation of those rate structures.)
- Size matters: A larger service population correlated with lower bills.
- System ownership matters: Municipal ownership structure (as compared to for-profit), correlated with lower bills.
Other factors that significantly correlated with higher bills were a purchased water source (as opposed to self-supply of surface or ground water) and higher bills among neighboring systems.
Contrary to the authors’ expectations, systems that serve populations with higher levels of income inequality and higher proportions of non-White population correlated with lower bills, but the authors note that these factors had relatively low explanatory power. This suggests the need for further study of how systems’ customer demographics relate to water bills. ‡
The authors also noted that the variables they were able examine left a majority of the observed variation unexplained. Other factors that can affect rates include, for example: a utility's receipt (or not) of financial assistance from a municipal general fund or from state or federal programs; a local government's diversion (or not) of ratepayer revenue to non-utility purposes; the efficiency of utility operations; excessive leakage from the utility's distribution system; a utility's level of investment in replacing and improving aging infrastructure; and more.
What are the policy implications?
The study and its findings are relevant to many critical policy questions, including utility rate structures, design of policies and programs to address household affordability, organization and governance of the water utility sector, prioritization of water systems for state and federal assistance, and the need for systematic data reporting.
First, the findings provide additional support for using lifeline rates and inclining block rates as tools to address water affordability challenges. The Water Affordability Advocacy Toolkit recommends that utilities consider lifeline rates, in which a low fixed charge included on all bills covers a level of water usage that meets basic indoor needs (adjusting for household size), as well as inclining block rates, in which the per gallon price rises for high levels of water usage. (See the Toolkit module on Equitable Water Rates.) The new study found that including a baseline allowance of water in a fixed charge, which is the basic structure of lifeline rates, and using inclining block rates both correspond to lower bills for essential levels of use.
Second, when developing a state or federal low-income water affordability or assistance program, policy makers must account in their program design for the huge variability in local water bills. The tremendous variation in bills means that the “delta” between actual bills and affordable bills differs widely from place to place, even for households with the same income. Therefore, at any given income level, within the universe of low-income households, the level of discounts needs to vary in order to ensure affordability. (There’s an important link between this point and the first point above. Specifically, more equitable rate structures, such as inclining block rates and lifeline rates, can help reduce the “delta” between current rates and affordable rates, making it easier for low-income discount programs to close the remaining gap.)
Third, consolidation of small water systems may, in appropriate cases and with robust community engagement and buy-in, help reduce bills for essential water service. The study found that smaller systems tend to have higher bills for essential service, and larger systems tend to have lower bills. Organizations like Community Water Center in California are demonstrating how a community-centered approach to consolidation can help small, rural, marginalized communities, for example, secure affordable access to safe water. Consolidation raises many complex concerns around governance, oversight, transparency, public engagement in decision-making, and other issues, and it is not the right solution in every case. Indeed, affordability can even be undermined in some cases by consolidation. But the new study’s findings suggest, as have others, that combining smaller systems into larger ones or joining them with existing, larger systems can—in the right circumstances and with the right safeguards—improve affordability.
Fourth, when privatization of a publicly owned water system is under consideration, there must be a careful consideration of impacts on water bill affordability. The study found (as have some others) that private ownership of water systems correlates to higher rates. There could be many reasons for this, some arguably more legitimate than others. For example, one specific practice that has been sharply critiqued as driving up rates excessively is use of the “fair market value” method to determine the sale price when a public system is acquired by a private entity. Unfortunately (and not coincidentally), the states with the greatest trends toward water system privatization rely on the fair market value method.
Fifth, state oversight of local water rates may contribute to greater equity in water bills across communities. The difference in within-state variation in water bills between Wisconsin (low variation) and the other three states examined (high variation) is striking. Wisconsin is the only U.S. state where virtually all water systems have their rates regulated by a state utility commission, regardless of their ownership status. There are many ways in which states could exercise greater oversight of local water rates, not limited to the Wisconsin model. State and local advocates for water affordability may wish to explore those options, many of which are discussed here, in the Water Affordability Advocacy Toolkit.
Sixth, the size of local water bills can help state and federal agencies prioritize communities for receipt of financial and technical assistance. As the study’s authors wrote, “extreme bill levels” in a community may be one indicator of the need for “increased and equitably allocated federal and state water infrastructure funding, assistance to promote systems’ technical, managerial, [and] financial (TMF) capacity,” as well as other options like “potential consolidation, customer assistance and affordability programs, and equitable rate design guidance” discussed above.
Last, but definitely not least, the study highlights the need for more and better data on water rates and water bills. Regularly collected, standardized, nationwide data on water rates and bills would allow for replication of this analysis in other states (to see how widely the results are generalizable) and tracking of trends over time. Moreover, data on actual bills received by customers, disaggregated by zip code and/or census tract, would allow for much better understanding of how water bills vary by income and race. Mandatory utility reporting requirements would help tremendously. Examples and recommendations for such requirements are collected here, in the Water Affordability Advocacy Toolkit. Another valuable model, enacted after publication of the Toolkit, is a utility affordability transparency law in New Jersey. California offers another approach; water systems there provide information on rate structures, rate schedules, and monthly water bills as part of comprehensive annual reports to the state. Further, at the federal level, even without new legislation, existing reporting schemes could be adapted to include information on water bills. For example, the study’s authors suggest “reforms to…[EPA’s Safe Drinking Water Information System] data collection [to] include bill levels.” EPA could also collect data on residential water bills through the Drinking Water and Clean Water State Revolving Fund (SRF) programs. Many other opportunities likely exist to collect data in connection with existing state and federal regulatory and funding programs.
NOTES:
* Data on actual bills received by customers are extremely scarce. Therefore, like most other studies, this one starts with utilities’ rate schedules and calculate bills at a standardized average level of usage. The selected usage level is intended to meet essential needs because everyone has a human right to safe, affordable water for indoor needs like drinking, cooking, cleaning, and sanitation—in contrast with discretionary outdoor uses like irrigating turf grass lawns. In this case, the study examines bills for modest usage associated with a three-person household. The authors acknowledge that this understates bills for larger households and for households with inefficient or leaky plumbing (which is most prevalent in lower-income housing). Data limitations did not allow for taking these factors directly into account. However, they must be taken into account when setting policies and rates—for example, by adapting certain rate structures (such as lifeline rates) to account for household size and by providing targeted water efficiency and plumbing repair assistance to low-income households.
** Other recent studies that compared rates within a single state, or in large systems across the country, have also found tremendous variation. Findings from other studies included:
- Across 111 communities in southeastern Michigan, “the monthly bills for 4,500 gallons of water varied greatly, ranging from $31 to $138 per month."
- Across the 500 largest U.S. water systems, annual water bills for 5,000 gallons ranged from $7 to $76, with an average of $28 (converting the annual bills reported in the study into monthly bills).
- Comparing average bills in counties with a population above 500,000 (from a data set of utilities in over 40 states) “combined water and sewer bills…can vary by a factor of five”.
- Across the 50 largest US cities, the monthly combined water and sewer bill for 50 gallons/person per day (at the local average household size) ranged from $22 to $125. Ten cities were over $90, while twelve cities were under $50.
‡ The study also looked for correlations between water quality violations and the size of water bills, but did not find any. As the authors noted, if perfect data were available, one might find that a high number of violations corresponds to rates that are too low to adequately fund the water system; or, conversely, one might find that more violations corresponds to relatively high rates being used to fund needed capital improvements. It may be that both situations commonly exist—as is often the case anecdotally—and therefore defy simple statistical correlations across a large dataset.
For more posts from this author, please see these blogs and LinkedIn articles.
Related Blogs

Political Control of Research Funding Threatens Sound Science

Governors, Legislators, and Utility Affordability: Broadening the Frame to Water
