New NRDC Tool Compares Electric Generation Cost by Resource
The tool will help state policymakers and regulators, project developers, institutions, and the public better understand the rapidly changing economics of the power sector
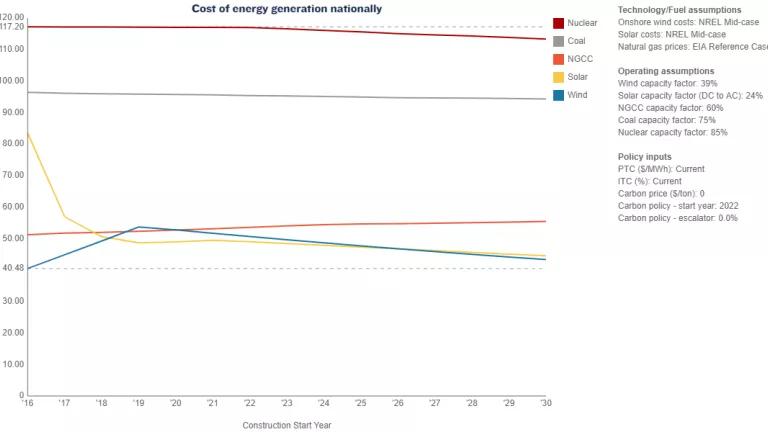
Levelized electricity costs including current policies
The Natural Resources Defense Council today launched a unique digital tool to help state policymakers and regulators, project developers, institutions, and the public better understand the rapidly changing economics of the power sector. Users simply open the tool, select the state they’re interested in, and compare the cost of generating electricity from different resources. To dive deeper, users can modify several cost and performance assumptions, as well as policies such as a price on carbon, to see how electricity costs change now and through 2030.
Along with displaying the current generation mix in each state, NRDC’s new tool calculates the levelized cost of electricity (LCOE), a metric widely recognized as the best way to compare the cost of producing power from different resources, on an apples-to-apples basis, over the life of a power installation. It allows cost comparisons between power generated from utility-scale solar facilities, onshore wind farms, and combined-cycle natural gas (NGCC), coal, and nuclear energy plants. NRDC expects to expand the tool’s set of technologies soon to include offshore wind and energy storage.
This tool improves upon other LCOE calculators by using up-to-date and regionally granular cost assumptions and relies on measured metrics for recently built solar and wind installations on a state-by-state basis. All assumptions are drawn from publicly available data, resources, and projections from national labs and agencies within the Department of Energy and reflect state-specific figures, where available. For instance, the capacity factor reflects how often a plant is generating electricity, and for variable resources like wind and solar, the capacity factor depends on the resource availability in the region.
The cost of generation is a significant component of electricity prices, and technologies with lower levelized cost, like solar and wind, should be deployed in conjunction with highly cost-effective energy efficiency measures to lower electricity bills for consumers. By identifying least-cost resources under different sets of assumptions—including how these costs are expected to change in future years—users can advocate for energy choices that chart a course for a lower cost, climate-friendly future in cities, universities, utilities, and states. This understanding of electricity generation costs can help inform energy decisions to reach aggressive climate goals—from emissions reductions targets to how much renewable energy should be required in the electricity generation mix of renewable portfolio standards.
Solar and wind energy are already the least-cost sources of electricity generation in more than two-thirds of the country, and this tool shows that they are expected to become the least-cost resource in almost every state in the country by 2030.
What is LCOE?
The LCOE is the minimum price at which electricity must be sold in order for an energy project to break even. First, it totals the capital costs of building a plant, financing costs, fuel costs (zero for wind and solar), and all other operating costs over the plant’s expected life. The sum is divided by the total electricity generated by the plant, in megawatt-hours (MWh), over its economic lifetime. The output – regardless of resource type – is a dollar per megawatt-hour ($/MWh) cost that allows for effective comparisons between electricity generation technologies.
LCOE calculations are generally limited to direct plant costs. Additional costs such as transmission lines and grid upgrades, energy storage, access to fuel supplies, and permitting, are not included because these vary significantly between projects. The LCOE also does not account for additional values like the price stability for renewables contrasted with the price volatility of fossil fuels, or the health benefits from reduced pollution. Inevitably, any method of comparison across diverse technologies is imperfect, but the LCOE is the preferred metric for comparing technologies.
Tool Insight: Wind and solar quickly become economic winners nationally
Between 2009 and 2017, the levelized cost of producing power from wind and solar declined by 67 and 86 percent, respectively, enabling them to out-compete other generation technologies in many regions and quadruple their national share of power delivered. Over the next 10 years, wind and solar costs are expected to fall further, quickly becoming the cheapest source of new power nationwide.
As an example of what information NRDC’s LCOE tool can provide, future national costs would look something like this under current policies:
Even without new policy favoring clean energy, these results demonstrate the growing strength and affordability of wind and solar power. From 2021 onward, wind and solar are the two cheapest sources of new power—even as federal tax credits expire or decrease. As shown below, renewable technologies as of next year will already be the least-cost resource in 34 states (68 percent). By 2030, they will be the most affordable option in 48 of the 50 states (96 percent). Consumers and advocates can use this information to encourage utilities and policymakers to accelerate the adoption of wind and solar power generation.

Least-cost resource between 2020 and 2030. Image credit: Sophia Ptacek and Jessica Russo
The economics of wind and solar vary significantly between regions. By 2030, solar is expected to be the least-cost resource in 27 states, mainly in the Southwest and Southeast, and wind in 21 states, predominantly in the Midwest.

Renewables have a growing advantage over fossil fuels. Power from new coal plants is one of the most expensive options, second only to new nuclear generation. In 2020, the levelized electricity cost from a new solar or wind installation is about half that from a new coal plant. Even when the highest cost assumption for renewables is chosen in the LCOE tool—reflecting ranges of uncertainty for future costs—electricity from a new coal plant is still much more expensive. As renewable costs continue to decline, the low cost of wind and solar will put similar pressure on gas: in 2020, new gas is the least-cost option in 16 states; by 2030, this falls to just two states: Massachusetts and Pennsylvania.
Tool Insight: State-by-state breakdowns and policy impacts
Solar or wind is the lowest-cost resource for new power even in states resistant to their deployment. For example, in Ohio, which just passed a law repealing its renewable energy and energy efficiency standards while providing hundreds of millions of dollars in subsidies to the state’s coal and nuclear plants, solar is expected to be the least-cost source of new generation from this year onward. After 2025, the falling cost of wind power would make it Ohio’s next-cheapest source of new generation.
The LCOE tool also allows users to explore the economic impact of new policies. For example, they can designate an initial carbon price, its start year, and an annual price escalator. Stanford’s Energy Modeling Forum recently explored a carbon policy case where a $25 per ton carbon price is imposed in 2020 and increases by 5 percent annually. At the national level, the effect is clear in the chart below: the economics of coal and gas quickly erode, providing solar and wind with an even greater cost advantage, as they immediately become the cheapest new power option in every state.

Levelized electricity costs with an increasing carbon price ($25/ton in 2020, annual increase of 5 percent)
To more accurately incorporate the health benefits of reducing carbon emissions, users can choose a policy that implements the social cost of carbon, setting a carbon price that increases annually to reach $53 per ton in 2030. If implemented in 2020, renewables immediately become the most affordable source of electricity generation in all 50 states. For municipalities and institutions looking to take bold climate action, accounting for carbon’s well-known and significant social costs helps clarify why rapidly shifting to renewable energy is not only cost-effective, it’s a clear winner for the public good.
NRDC’s new LCOE tool confirms the improving economics of clean energy and bolsters the economic and environmental case for the recent commitments by states, businesses, and utilities to go further and faster on clean energy. All utilities and states should be investing rapidly in these renewable technologies, as well as energy efficiency, not only to clean up emissions, but also to save their customers money.
NRDC will hold a webinar on the new tool from 1-2 p.m. ET on Tuesday, Sept. 24. Register here for specific details that will be forthcoming soon.
Related Blogs

COP29: Key Outcomes Signal Need to Deliver Greater Climate Action

Overseas LNG Investment Undercuts U.S. Climate Credibility