As former President Reagan once put, we need to be able to “Trust, but verify.” This was wise advice. Results from five, independent studies appear to verify that the cost-estimates developed by government agencies on fuel economy are reasonable and conservative. How many studies line-up with the Alliance of Automobile Manufacturers (AAM) exaggerated cost claims which are based on analysis by the Center for Automotive Research (CAR)? None.
Last week, Boston Consulting Group (BCG) released a new report stating that “internal combustion engines are improving their ability to cut CO2 emissions” at a cost “roughly half what we predicted three years ago.” [emphasis added]. As a result "carmakers should be able to meet 2020 emissions targets mainly through improvements to conventional technologies." That's what the government agencies have been saying for some time now.
NRDC’s analysis shows that the 40% reduction in CO2 considered by BCG for 2020 would correspond to a 5 to 6% annual improvement rate over the MY2016-2020.[1] This is within the range now being considered by the Obama Administration for the next round of national fuel economy and carbon pollution standards for new cars and trucks.
The cost-estimates from BCG support estimates from three government agencies and are far below exaggerated cost claims by the Alliance of Automobile Manufacturers (AAM).
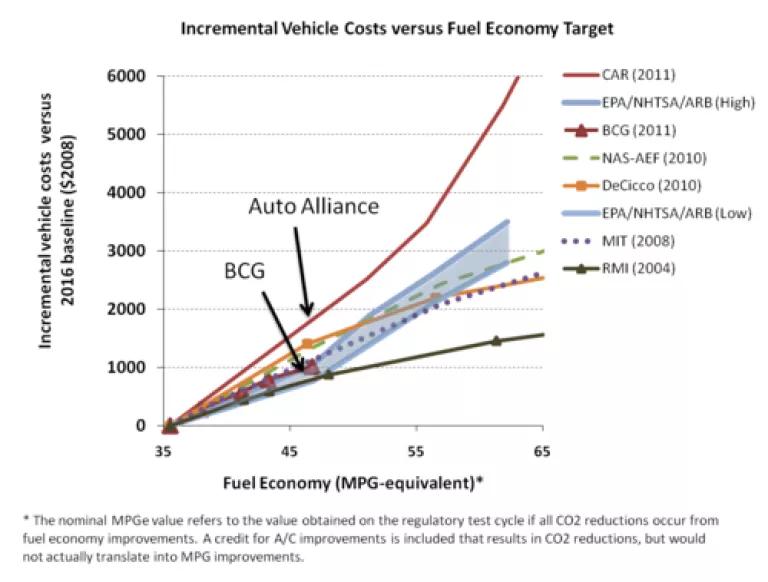
Below, we compare BCG’s latest cost estimates versus other studies that evaluated costs over the 2020 to 2035 time period.[2] In sum, five independent cost-assessments, including researchers at Boston Consulting Group, Massachusetts Institute of Technology, National Academies of Science, University of Michigan (DeCicco), and the Rocky Mountain Institute, all fall within the range or below those estimated by the three government agencies (EPA/NHTSA/ARB). AAM's cost claims are far outside the range of estimates.
The cost estimates cited by AAM assume virtually no technology improvement or cost reductions. All other studies incorporate these effects.
Unfortunately, the AAM cited figures fail a simple quality check, relying on faulty assumptions such as (1) current technology costs remain virtually unchanged over a decade and a half, (2) current fuel efficient technology packages do not improve, and (3) no new technology innovations occur. Several organizations have already debunked this study, including NRDC, ICCT, and UCS, citing faulty assumptions, misused data, and basic technical and mathematical errors.
It’s unfortunate that the auto industry advocacy group continues to overstate costs and ignore their own members' historic cost-reductions, technological innovation, and the engineering talent, as well as those of hundreds of global suppliers of fuel efficient products.
A far more comprehensive and authoritative set of cost and technology assessments have been developed by three, separate government agencies.
In contrast to the faulty spreadsheet analysis conducted by CAR, estimates from three government agencies have relied on years of information and in-depth analysis based on:
- Landmark studies of fuel-economy potential based on computational vehicle simulation modeling
- Highly accurate and comprehensive “tear-down” studies that inventory all components of a vehicle technology and their respective costs
- Hundreds of individual meetings and confidential business information submissions from automakers and suppliers
- Staff expertise including ex-industry engineers with hands-on experience as well as industry engineering consultants that advise automakers and suppliers
- State-of-the-art vehicle development and testing laboratories
The agencies have done their homework on costs and the results have been verified as reasonable. As for the AAM's cost claims? The only thing we can verify is that their numbers can't be trusted.
[1] The study estimates of a 40% CO2 reduction by 2020 from 2010 levels. A 40% reduction from the 2010 baseline of approximately 26 mpg (342 gCO2/mi) results in 43.3 mpg (205 g/mile, test-cycle), not accounting for reductions from air conditioning improvements which were not included in the BCG report. An improvement from MY2016 standards of 34.1 mpg to 43.3 mpg by MY2020 represents an average 5.8% annual improvement in CO2 emissions.
[2] Assumptions used in this graph are documented in a previous blog, found here. We note that we use the same 2016 baseline as used by EPA/NHTSA/ARB (2010) across all studies.
Related Blogs

EPA Announces GGRF Awards

EPA’s Latest Heavy Duty Vehicle Rule Does Not Meet the Moment