Cost Estimates by Agencies Are Reasonable and Support the Strongest Possible Fuel Economy and Pollution Standards

On Saturday, the Detroit News reported leaks that the Administration will propose a 5% average annual improvement in fuel efficiency and carbon pollution standards for new cars and new trucks – equivalent to 56.2 miles per gallon (mpg) by 2025. This follows up on EPA, NHTSA, and California Air Resources Board’s joint announcement to establish harmonized standards for model years 2017 to 2025 that will reach the equivalent of 47 to 62 mpg by 2025 (a 3 to 6% annual improvement rate). We continue to support 60 mpg as the best standard for consumers, and reducing pollution and oil dependency.
Automaker trade associations are already criticizing the 56 mpg or 5% improvement level and calling for the weakest standards, even as low as a 2% annual improvement. They claim that fuel economy technologies will be too expensive to produce, citing just one study by the Center for Automotive Research (CAR 2011), an organization that receives funding from the automotive industry.
We show below that the CAR analysis relied upon by the trade associations fall on the highest end of the literature range, largely due to faulty analysis and unreasonable assumptions, while EPA/NHTSA/ARB’s joint cost estimates fall into the upper-middle of the range of forecasts.
Our review shows that the cost estimates developed by three government agencies appear reasonable and are in the upper middle of the literature range.
The three federal agencies, over the past several years of rulemakings, have developed detailed assessments on current, near-term, and longer-term fuel efficient vehicle technologies. The agencies have conducted numerous analysis to evaluate costs and technology potential, including computational vehicle simulation modeling and “tear-down” studies that evaluate the costs of each component of a technology. We compare various estimates of the incremental vehicle costs of going from model year (MY) 2016 fuel economy levels to the MY2025 levels being considered by the three agencies.
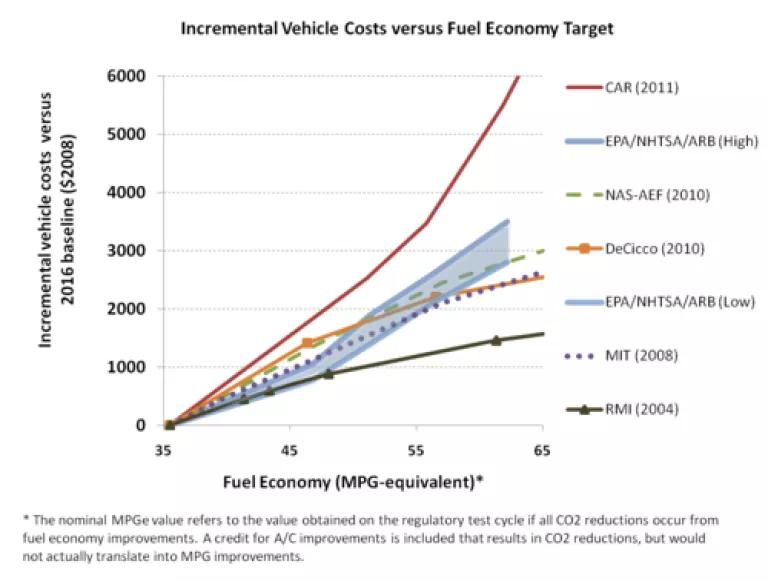
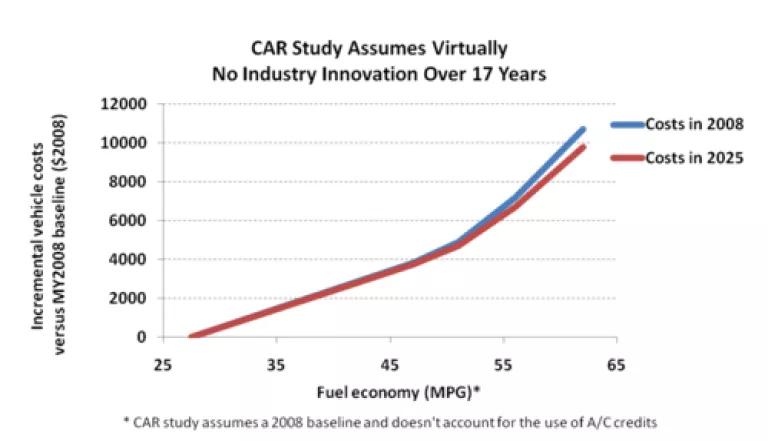
The CAR 2011, relied upon by the auto industry [red solid line], far exceeds the range estimated by other studies. In a previous blog, my colleague Roland Hwang dissected the CAR report and laid out six specific reasons why their estimates are so far out of line.
The auto trade association’s widely cited cost estimate, from the Center for Automotive Research, assumes virtually no innovation over a 17 year period.
Just one reason for CAR's high cost estimates is due to an unreasonable assumption that fuel efficient technologies will see virtually no cost reductions or technological improvement over the 2008 to 2025 time period.[*] This belies the automakers’ own demonstrated innovations in recent years. For example, as my colleague Luke Tonachel previously blogged, Ford Motor Company recently announced that their new C-Max 5-passenger hatchback, going on sale next year, will have a hybrid system that is 30 percent less expensive than the system included in their 2010 Ford Fusion Hybrid. Hyundai’s new Sonata also features a new hybrid configuration that cuts cost.
The three agencies’ cost-estimates support the strongest possible standards
As the negotiations continue, the Administration should set the strongest possible standards, based on sound independent analysis, and not allow the associations to push down the scale to the detriment of consumers. Automakers certainly have the engineering talent and ingenuity to do better and have said as much. Now all we need are standards that enable a race to the top and not the bottom.
References and notes:
1. Links to the sources evaluating mid-term (2020-2035) technology costs can be found here:
2. All fuel economy values show compliance values as opposed to on-road fuel economy. Fuel economy cost-curves were developed based on the data provided in the reports. All cost information was converted to $2008 using GDP cost deflators. In instances where A/C credits were not included, the estimated 15 gCO2/mile credit was applied together with the incremental costs, per EPA/NHTSA/ARB’s assumptions. In instances where individual technology costs (e.g. hybrid, advanced gasoline internal combustion engine, etc.) were provided, the technology share mix to achieve the fuel-economy cost-curves were optimized to achieve least cost. Car and light truck sale fractions were assumed from EPA/NHTSA/ARB (2011).
4. The upper figure shows the incremental costs from a MY2016 baseline (equivalent to 35.5 mpg-equivalent), consistent with the regulatory analysis that will be conducted by the agencies. To normalize the baselines between studies to a 35.5 mpg-equivalent level, the adjustment was based on the actual cost curves developed from each study. For example, if a baseline started at 26 mpg-equivalent, the cost curve was followed up to a 35.5 mpg-equivalent level and set as the origin.
5. The bottom CAR curves show the actual cost curves reported in the study (unadjusted for A/C credits).
6. Compliance values for any plug-in electric vehicles assumed in each of the studies were developed assuming the approach developed in the final rule of the National Program for MY2012-2016. This includes accounting for upstream electricity emissions with an adjustment made to account for gasoline upstream emissions not being included.
* CAR’s estimates are that costs will be reduced between 1-8% over the entire 17 year period, or an improvement rate of 0.08% to 0.5% per year.
Related Blogs

EPA Announces GGRF Awards

EPA’s Latest Heavy Duty Vehicle Rule Does Not Meet the Moment