How Missing Water System Boundaries Affect Our Communities
The lack of public water system boundary information in the United States puts public health at risk.
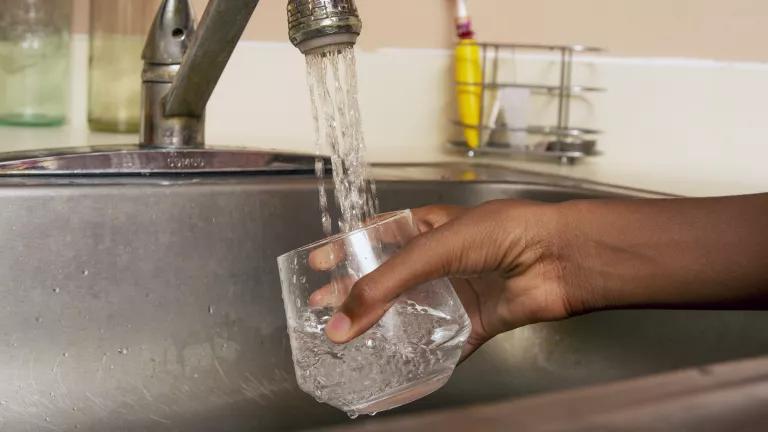
Shima Green for NRDC
This blog was written by Jeong Shin, a 2023 Schneider Fellow with NRDC’s data science team. Jeong Shin studies symbolic systems and Asian American studies at Stanford University.
Is ignorance bliss?
When it comes to understanding the source and quality of our drinking water, ignorance is not bliss. More often than not, answering the questions of where our drinking water comes from and what our water system is doing to keep us safe is challenging. The many gaps in information on drinking water in the United States put individual and public health at risk.
Where does your water come from?
Not all public water systems are created equally. They differ in their infrastructure, reliability, and capacity to provide clean and safe drinking water to the public. One main reason that contributes to these discrepancies is the level of regulatory oversight and compliance that differs from one public water system to another. According to the Watered Down Justice report, the rate of drinking water violations is higher in public water systems that serve people of color, low-income people, and non-native English speakers. Moreover, the U.S. Environmental Protection Agency (EPA) regulates only a small subset of drinking water contaminants, and it has failed to adopt a single new standard for any unregulated contaminant since 1996. Despite this, the EPA does require certain public water systems to test for some unregulated contaminants, the results of which are made available for public access in the EPA’s Safe Drinking Water Information System (SDWIS) database. The database also provides details regarding the number of people served by each public water system and the number of violations associated with each one.
Though the SDWIS database provides this information, the EPA ties it to a public water system ID and not a map. Therefore, it is difficult to ascertain a geographic connection between the violations data and the people who are affected, making it harder for us to identify which communities are served by public water systems that have contaminants. This summer, I worked to fill in these gaps by mapping the geographic boundaries that each public water system serves. In developing the methodology to accomplish these goals, the main obstacle we faced was a lack of water system boundary data, as only nine U.S. states, and no territories, have mapped and provided the data on their public water systems.
We used three key sources of data for our analysis:
- Nationwide zip code boundary information, which included geographic shapes outlining the coverage areas throughout the entire United States;
- Zip codes associated with each Public Water System Identification (PWSID) from the EPA’s Occurrence database; and
- Water system summary report data from the SDWIS.
With these datasets, we were able to connect public water systems with the zip code boundaries they served. Moving forward, we can now connect these geographic areas to the types and levels of contaminants in a community’s water source. This will allow us to visualize the communities that are being served contaminated water and which public water systems are putting their communities’ health at risk.
Below is an overview of the states that provided data on their public water systems (“State Provided”) versus the states that have not (the “Zip Code Based” map we created).
Overlaying with environmental justice datasets
Importantly, this map layer can be overlaid with environmental justice datasets to understand the relationship between water contaminants and various environmental burdens and demographic indicators. In communities that are already environmentally disadvantaged, such as those assessed by the Climate and Economic Justice Screening Tool (CEJST) and the Environmental Justice Index Explorer, the issue is exacerbated; those communities are already contending with health threats due to their surrounding environments (e.g., air pollution, proximity to toxic sites, linguistic isolation), but now even more so because of unsafe drinking water. We understand that there is a long-standing history of disturbing relationships between drinking water violations and race and socioeconomic status, so incorporating this analysis is important to protecting vulnerable communities.
Having access to a map that offers information about a public water system and the people who live within its boundaries will allow us to analyze how contaminants in their water may be compounding the environmental burdens they already face.
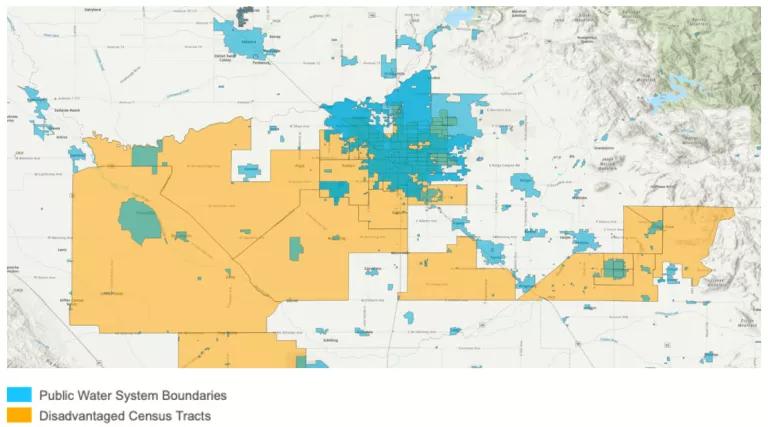
Figure 2. A closer look at the public water system boundaries in Fresno, California, which overlay disadvantaged census tracts identified by the CEJST
Jeong Shin
Although there remains much to be done to ensure access for all to safe and affordable water, I’ve realized that tackling questions pertaining to water safety is not impossible. If all states took the initiative to record and provide access to their water system boundaries, they could help to ensure the level of transparency that community members deserve and provide a foundation for initiatives dedicated to improving drinking water monitoring and standards.
Related Blogs

California Walks Away from Hundreds of Millions of Dollars for Safe Drinking Water

Now Is the Time to Advocate for Safe Drinking Water