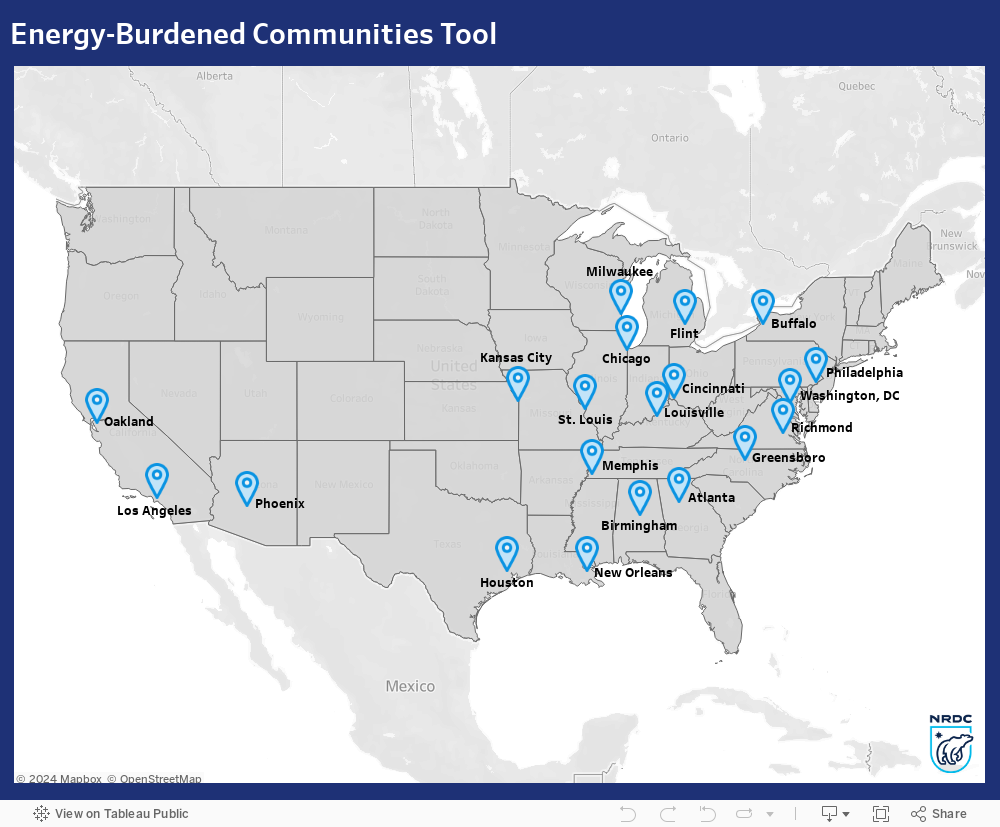
Energy-Burdened Communities Tool
Energy burden has disproportionately impacted low-income communities of color for decades. NRDC is actively working to bring justice to these communities through this mapping tool.

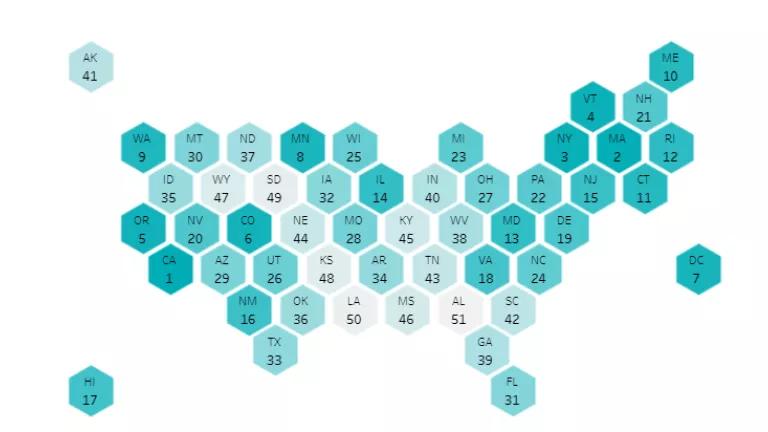
Our access to energy has come to define our everyday lives, and it is crucial for comfort, mobility, well-being, and health. Yet 38 percent of households in the United States have a high or severe energy burden.
Energy burden is the percent of a household’s median annual income that is used to pay for electricity and gas bills. Households with a high energy burden pay more than 6 percent of their income on energy bills; those with a severe energy burden pay more than 10 percent.
Low-income families of color disproportionately experience higher energy burdens, which causes a higher income stress, more adverse health outcomes, a greater risk of displacement, and more. Caused by energy inefficiency and lack of investment, these injustices become exacerbated with time.
More From Our Experts
The U.S. Department of Housing and Urban Development’s Green and Resilient Retrofit Program and the U.S. Department of Energy’s Home Energy Rebate Program allow us the opportunity to put an end to these injustices by allocating funds to improve energy efficiency in homes.
To ensure an equitable dispersal of funds, our new Energy-Burdened Communities Tool was designed to uplift the energy-burdened communities that need these investments the most. The tool identifies the census tracts in 20 U.S. cities that have a high energy burden and are, simultaneously, low-income. There are also multiple layers that allow users to explore how race, health, and displacement overlap in these energy-burdened areas.
In using this tool to conduct research, advocate for local policies in energy and housing justice, and allocate federal funding to energy-burdened residents, we hope it gets us one step closer to ensuring housing and climate justice for our communities.
For a quick tutorial with explanations and clarifications about the tool, please watch the following video:
Ready to use the tool? Select a city to get started!
This map was created by Maria Correa, NRDC Schneider Fellow, using data from the Greenlink Equity Map. The thresholds used for each indicator are as defined by the federal government's Climate and Economic Justice Screening Tool.
Related Resources

Principles for Parks and Equitable Development
What Now for the Greenhouse Gas Reduction Fund Green Finance Programs?