Enhancing EPA’s Proposed Carbon Standards on Gas Plants
What would happen if the EPA adopted carbon pollution standards for gas plants by total plant size? Greater—and cheaper—emissions reductions.
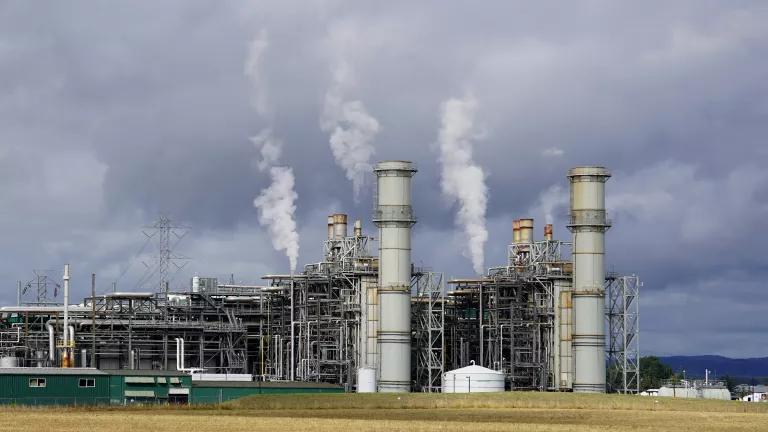
The Chehalis Generation Facility, a gas-fired combined-cycle power plant in Washington
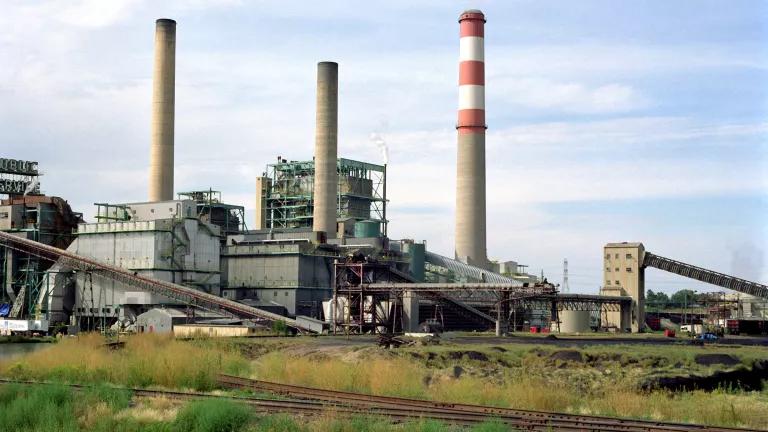
The U.S. Environmental Protection Agency (EPA) has proposed rules to curb carbon pollution from power plants. The rules provide long-overdue emissions rate limits for coal plants, new natural gas plants, and some existing gas plants. These plants are responsible for almost one-third of the United States’ carbon footprint—a source of pollution that until now has gone nearly unchecked.
While this proposal is a vitally important first step, the EPA can do more, faster.
NRDC has submitted comments to the EPA on its proposal, identifying key areas where the EPA could strengthen the rule to achieve greater emission reductions on a faster timetable. One clear opportunity is to modify which existing gas plants are covered by these standards. The EPA has proposed to cover individual units larger than 300 megawatts that run more than half of the time. We recommend that the EPA instead adopt a standard based on total plant size—not the size of individual units. There can often be many individual units located at one plant site; by adjusting the threshold to account for total facility size, the EPA can target the largest sources of gas-fired carbon pollution today. And these larger plants often have more cost-effective, economic opportunities to deploy technologies that cut their emissions, resulting in a rule that can maximize emission benefits while minimizing costs.
These standard-setting questions can often be wonky. To help visualize their impact—both of the EPA’s approach and our recommended alternative—we have created an interactive dashboard that allows users to easily adjust thresholds and automatically see how changing the thresholds can alter the power plants covered, as well as what it means for the total capacity, emissions, and geographic distribution of potential covered sources.
The buttons at the top of the dashboard switch between the plant and unit levels. Click and drag to explore the map and hover over any point to learn more about a specific plant or unit. The unit dashboard shows which plants would be covered under the EPA’s proposed threshold, but the sliders on the side allow for exploration of other potential thresholds for both plants and units and the effect these thresholds would have across the country.
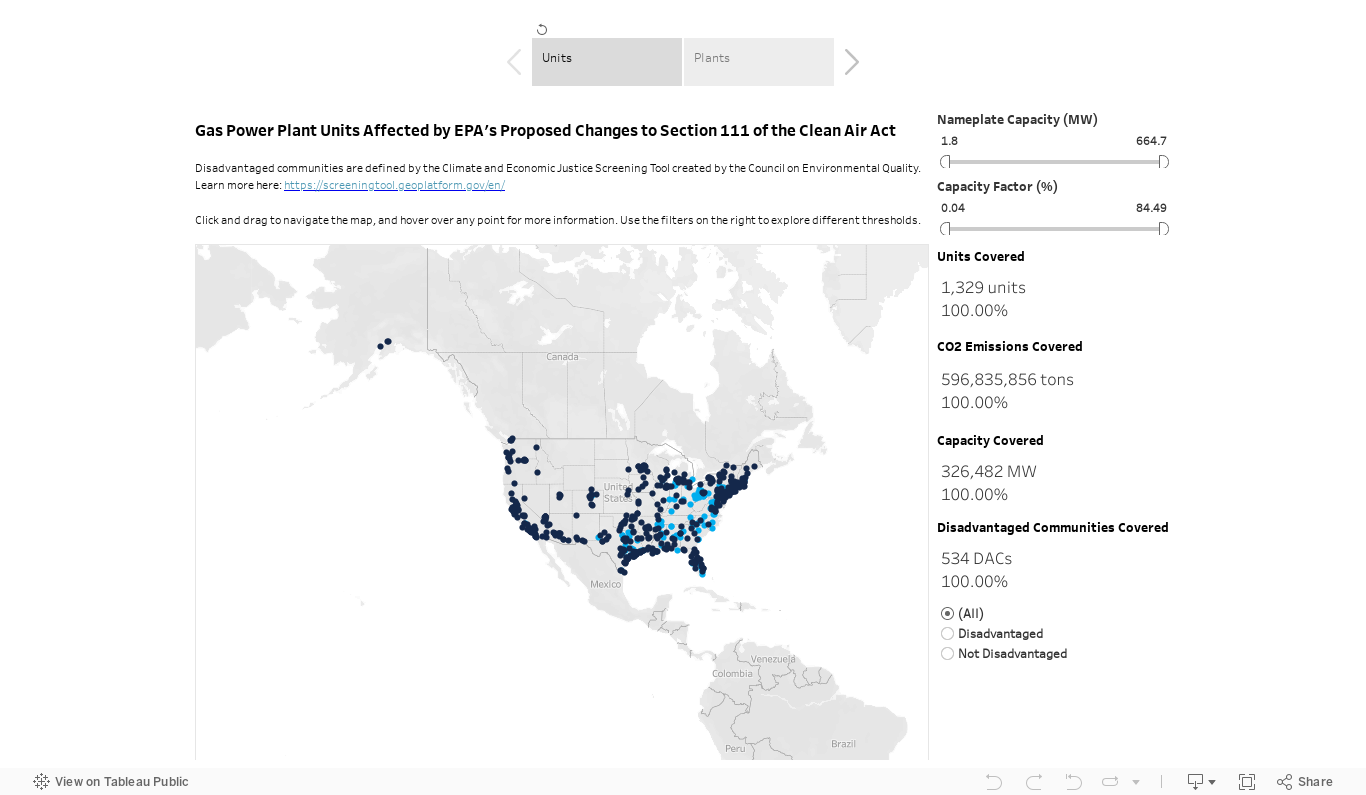
Users can also use the filter at the bottom right to explore which units are located in disadvantaged communities. Disadvantaged communities are defined using the Climate and Economic Justice Screening Tool, which uses thresholds on climate, energy, health, housing, legacy pollution, transit, water, and workforce. We have marked power plants and units as “disadvantaged” only when they are completely located within the disadvantaged community.
Related Resources
Strengthen Power Plant Carbon Standards for Greater Climate Benefit

The EPA Tackles Power Plants’ Carbon Pollution

The Clean Air Act 101
The Supreme Court’s EPA Ruling, Explained