A Race to Track the Southern Seas
To help prepare coastlines for the worsening effects of the climate crisis, scientists need more historical sea level records from the Global South—and they’re looking everywhere, from libraries to attics.

The narrowest point of Fongafale Island, Tuvalu, in March 2019. On the left is the Pacific Ocean, and on the right is the lagoon at the center of the Funafuti atoll. Tuvalu has been identified as one of the world’s island nations most vulnerable to climate change. Sean Gallagher
As the planet warms and melting ice at the poles raises sea levels, scientists around the world are searching through libraries, archives, and even people’s attics to find tidal records from before and throughout the early industrial era. Such records could give us a glimpse into how our carbon emissions are likely to reshape the world’s coastlines and seaside communities in the decades to come.
To make reliable estimates about where sea levels may be in 2050, 2100, or later, scientists need at least 60 years’ worth of historical data. More is better. While archivists have made some impressive data finds in recent years, there remains a big problem: The overwhelming majority of known sea level records from before the mid-20th century come from the Northern Hemisphere, while such data for the Southern Hemisphere are proving hard to come by.
“These records were historically taken by naval organizations and for trade purposes,” says Elizabeth Bradshaw, a sea level data scientist at the National Oceanography Centre (NOC) in the United Kingdom. “A century ago these activities were concentrated in the Northern Hemisphere.”
As you can see from the map below, huge stretches of the coastlines of Africa and South America as well as parts of Asia are currently missing these historic reference points, as are many Pacific Islands, some of which are already being swallowed by the sea at frightful rates. Filling in this data gap is an especially pressing issue for those living in the Global South, so they may pinpoint the coastal communities, infrastructure, and food supplies most at risk from the impacts of climate change.

E. Bradshaw, L. Rickards, and T. Aarup, "Sea Level Data Archaeology and the Global Sea Level Observing System (GLOSS)," GeoResJ 6 (June 2015): 9-16.
“Understanding historic sea levels will help us not only to identify long-term increases, but also to predict the frequency of storm surges, flooding, and tsunamis—events that threaten the safety of vulnerable communities,” says Andy Matthews, technical manager at the NOC’s Liverpool-based Permanent Service for Mean Sea Level, which has been analyzing data from tide gauges around the world since 1933.
The missing records also hamper our understanding of how much sea levels are changing everywhere. To grasp why, you have to know a little secret about the ocean.
Sea Level Isn’t Level
Sea level varies from place to place. To put it another way, the ocean does not behave like a giant bathtub.
There are several reasons for this. The first is gravity. Because the planet isn’t uniform, the gravitational forces acting on the ocean at any given place also differ. Large, dense landmasses tug at the water, causing sea levels to be higher in some areas than in others.
This gravity factor creates several interesting phenomena. For example, if you were to sail from New York City to Southampton, England, you would actually have to sail several meters “uphill.” Also, when a glacier melts, the sea level in its immediate vicinity drops rather than rises. That’s because the loss in the glacier’s mass diminishes the ice’s gravitational pull, allowing the seawater to move away from it. Along with other factors, this push away from the polar regions is expected to raise sea levels quickly in the equatorial Pacific, making data from this area especially valuable.
Earth’s rotation also affects sea levels. As the planet spins, it generates a force that causes the sea to bulge outward. Because the force is most powerful at the equator, sea level is higher at lower latitudes.
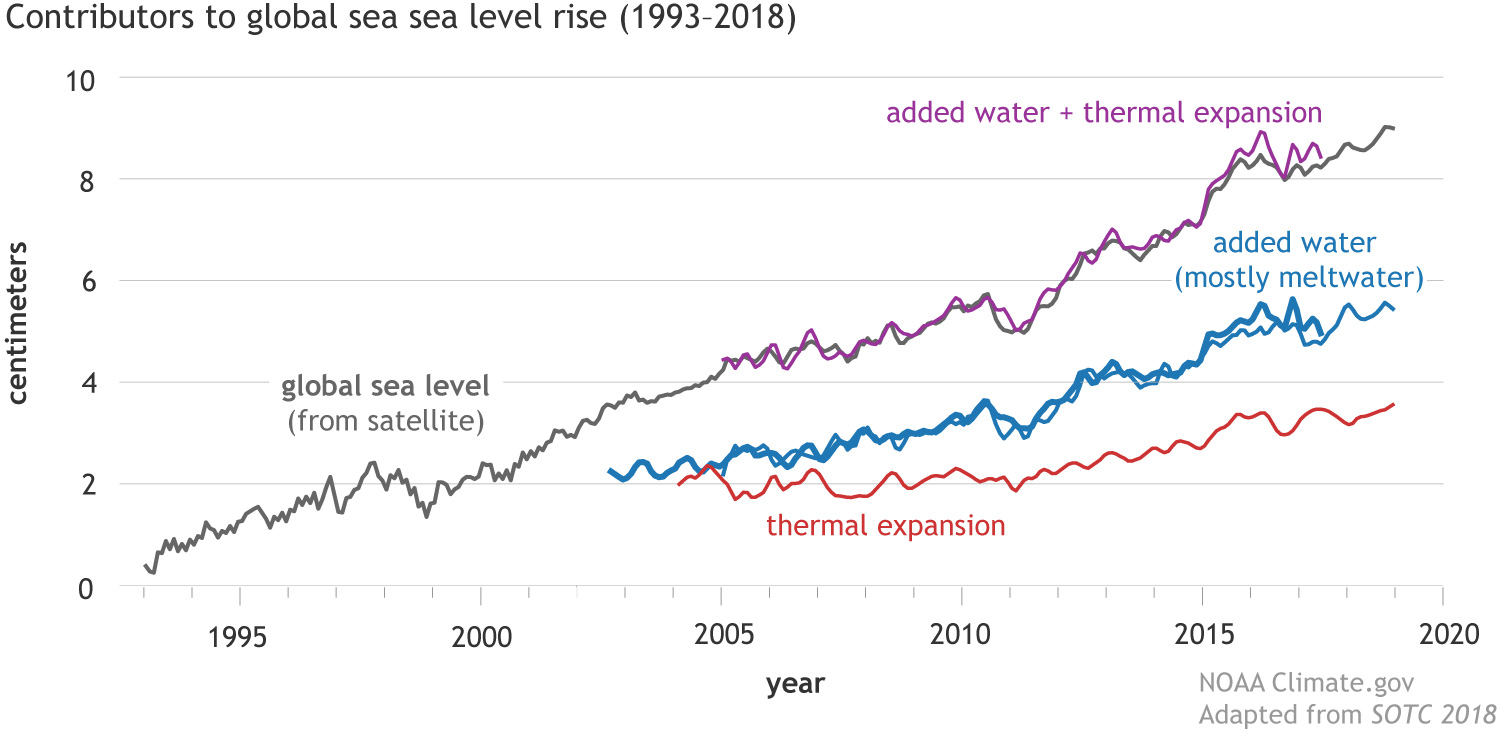
It gets even more complicated. The sea level in any individual location varies over time due to waves and tides. And then there’s the land itself, which rises and falls due to tectonic shifts; the movement of glaciers; and the withdrawal of groundwater, which affects the relative height of the sea. Also, because water expands as it warms, the temperature of the oceans can influence how their waters are distributed.
Taken together, these nuances mean that, in order to establish global average sea level, it’s not enough to measure changes in one place or even a few places. Researchers need detailed records from all over the world, taken over long periods of time.

Measuring the Sea
Sea level records come in many forms. Some of the earliest were produced by harbor workers, who need to understand tidal changes to ensure waters are deep enough for ships to travel safely in and out of ports. In the old days, nobody was thinking about how important these logs might be in the future.
“The earliest measurements in the 19th century were taken from poles,” says Matthews. “Someone would go and look at a pole in the water, and they recorded sea level at high or low tide.”
Starting in 1851, technology relieved humans of the burden of taking measurements this way. A tidal gauge had a float resting on the surface of the water. Attached to the float was a string that ran over a pulley and connected to a pencil on the other end. As the water level rose and fell, the pencil moved up and down across a rotating drum, similar to how a seismograph works. The tidal gauges produced long rolls of paper, offering continuous, detailed information about sea level.
But the gold standard for historical sea level data requires something more. Ideally, researchers need a reference point, such as a mark on a rock, that demonstrates the starting point for the float gauge—otherwise the tidal gauge’s readings would just be wavy lines on a piece of paper. Taken together, these measurements plus the physical markers give a more comprehensive picture of sea level changes.
Fortunately, some records from the Southern Hemisphere have started to come to light. In 1841, when the island of Tasmania was a British penal colony known as Van Diemen’s Land, the Antarctic explorer James Clark Ross ordered that a “benchmark” be struck into a rock at Port Arthur. Scientists have been aware of this mark on Tasmania’s southeastern coast for more than a century, but the benchmark alone wasn’t particularly useful—all it indicated was the water level at one particular moment in time. In 2002, however, a team of archivists discovered and published sea level measurements taken at Port Arthur between 1837 and 1842. The data recorded changes in sea level relative to the 1841 benchmark, giving scientists years’ worth of records that they could then be compared with present-day measurements to show what’s been happening over the last 180 years.

Fortuitous discoveries like the one at Port Arthur, and another one on the uninhabited Saint-Paul Island in the southern Indian Ocean, are exceedingly rare. But since they are so important to sea level modeling, the search continues. As you read this, there are people scouring coastal rocks in the Southern Hemisphere on a quest to find physical markers, while archivists pore through colonial navy records in search of more measurements.
“We’ve exhausted a lot of the obvious stores, like national archives,” says Bradshaw. “Now it’s about asking members of the public or people with an interest in archaeology or their own family history to join the search. People around the world have been measuring tides. We know the records must be out there.”
Could you make the next big discovery? Even if you don’t have an antique tidal logbook stashed in your basement, you can still help. Scientists need to digitize old, handwritten sea level records in order to add them to their data sets, and they’re looking for citizen scientists to give them a hand.
This NRDC.org story is available for online republication by news media outlets or nonprofits under these conditions: The writer(s) must be credited with a byline; you must note prominently that the story was originally published by NRDC.org and link to the original; the story cannot be edited (beyond simple things such as grammar); you can’t resell the story in any form or grant republishing rights to other outlets; you can’t republish our material wholesale or automatically—you need to select stories individually; you can’t republish the photos or graphics on our site without specific permission; you should drop us a note to let us know when you’ve used one of our stories.
When Customers and Investors Demand Corporate Sustainability
These Photographs Show How the Rising Sea Connects Us All
A New York Climate Justice Activist with Roots in the Blue Ridge Mountains