Additional Research on Household Food Waste
New research findings from MITRE and Gallup align with NRDC's prior research into household food waste.

A family eating lunch in their kitchen.
Jessie Casson/Getty Images
Household food waste accounts for 40 to 50 percent of all food wasted in the United States—according to the EPA, this amounts to about 26.5 million tons of food waste every year. All this wasted food wastes money, labor, and all the natural resources that went into producing, processing, transporting, and storing it—as well as emitting climate pollution at every stage of the food system.
Better understanding why and how households waste food is critical to actualize our national goal to reduce food waste by 50 percent by 2030, yet information on both quantities and reasons for household food waste is sparse. A study from MITRE and Gallup surveyed nearly 10,000 households across the U.S. to interrogate their food waste behaviors and attitudes; 257 of those participants completed kitchen diaries, tracking their discarded food for one week. Many of their findings align with NRDC’s prior research into household food waste.
In 2017, NRDC’s work to help cities reduce food waste took a deep dive into where and why food waste occurs in three U.S. cities (Denver, Nashville, and New York City), with a particular focus on behaviors and attitudes on household food waste. More than 1,000 households in the three cities agreed to participate in the study, beginning with a survey of demographics, behaviors, and beliefs. 600 households also completed kitchen diaries; the research team also conducted nearly 300 bin digs at these households to ground-truth the diary data. Taken together with the MITRE/Gallup research, the two studies offer important information on what we’ve learned and where we still need more information.
The MITRE/ Gallup study is the largest known representative study of food waste in the U.S. to date, providing key data that can help in planning strategies to prevent food from going to waste in the first place, rescue and redirect surplus food, and recycle food scraps. Below are some highlights of findings from both the MITRE/Gallup study and the NRDC study.
Key Survey Findings
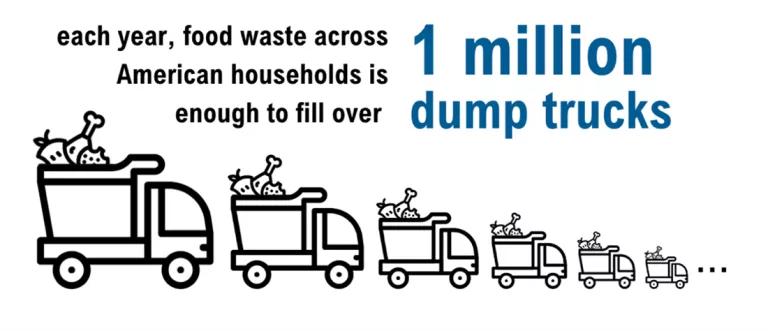
- The MITRE/Gallup study determined that the average amount of food wasted per each American household is 6.2 cups (roughly 2.1 pounds) per week of edible food, or 8.8 cups (about 3 pounds) per week if inedible food parts, like chicken bones or banana peels, are included. Extrapolated across all American households, that would be enough wasted food to fill 1 million dump trucks. The NRDC study found the average amount of food wasted in households in the three cities researched to be 2.5 pounds per week for edible food and 3.5 pounds per week including inedible food parts— but those numbers are per capita, not per household. Per household estimates were much higher, at 6.0 pounds of edible food per household and 8.7 if inedible parts are included. Some of this discrepancy may derive from the challenge in converting volume-based data to weight-based data, particularly given that about half of participants in the MITRE/Gallup kitchen diary portion of the study tracked their waste using volume estimations only (the remainder coupled volume estimations with scale weights). Additionally, the NRDC kitchen diary participants tracked beverage discards—a significantly heavier than average food type—along with other foods; in fact, coffee and milk ended up being two of the most commonly wasted single food types.

MITRE
- Leftover use is a critical factor linked to food waste amounts in the MITRE/Gallup study. Those who report frequently—at least 2-3 times per week—throwing away leftovers because no one wanted to eat them estimate wasting approximately 12 cups of food each week, while those who report infrequently—once a month or less—throwing away leftovers because no one wanted to eat them estimate wasting only 3.5 cups per week. Over two-thirds (68 percent) of NRDC study respondents claim to prioritize eating leftovers “always” or “most of the time,” though 13 percent identified their households as not liking leftovers. In kitchen diary logs, where respondents noted a reason for discarding each item, only 11 percent of food was reportedly discarded due to it not being wanted as leftovers. Further research and targeted interventions should hone opportunities for these households to reduce unwanted leftovers to limit wasted food.
- 31 percent of households in the MITRE/Gallup study said they often or always throw away food that has passed the date on its label. Those who often or always throw away food that has passed its date label waste more than double the amount of food (8.9 cups per week) than those who never or rarely throw away food that has passed its date label (4.0 cups per week). In the NRDC study, 46 percent of respondents cited date labels as being the main source of information used when deciding to throw away food. However, 87 percent of respondents also noted that they frequently use sight, taste, or smell to determine if food is safe to eat, and only four percent of food discards tracked in the kitchen diaries were reportedly due to being past the date on the label, perhaps suggesting that people tend to use more than one strategy when deciding whether or not to consume food. Clarification and improved understanding of the meaning of food date labels offers an opportunity to reduce household food waste.
- 86 percent of households in the MITRE/Gallup study believe that people should do more to reduce the amount of food that is wasted. In the NRDC study, 78 percent of respondents agreed that reducing the amount of food they throw away would be good. The NRDC question included personal ownership over the action while MITRE/Gallup’s question was about people in general. Additionally, over half of the NRDC group disagreed with this statement: “Given the amount of food that is thrown away in this country, the actions of my household won’t make a meaningful difference in the amount of food being wasted,” showing that they feel that their actions do have the potential to make a difference. Similarly, in the MITRE/Gallup study, 53 percent of respondents disagreed that there is not much they can do to minimize the amount of food thrown away in their household, indicating that they believe there are ways they could reduce their food waste.
- The MITRE/Gallup study did not find meaningful differences in the level of concern about food waste based on household size, number of children at home, level of education, or level of income. However, the study did find that households with higher income and higher education wasted more than households with less education and lower income. The NRDC study found, across the three cities, little to no significant relationship between the amount of food wasted and race/ethnicity, national origin, income level, primary language spoken at home, amount spent on food eaten either at home or away from home, or households previously familiar with the issue of wasted food versus households previously unfamiliar with the issue of wasted food. Household size was found to be related to the amount of food wasted, with the general trend that smaller households waste more food per capita; as household size increases, per capita total food waste generation decreases. The MITRE/Gallup study also found that smaller households waste more food per capita than larger households.
- In the MITRE/Gallup study, respondents indicated that price was a primary food-related issue for them, with 81 percent of households naming price as a concern. However, a smaller set of respondents (33 percent) showed awareness that the average American household could save as much as $1,500 per year by wasting less food. About half (49 percent) estimated the potential savings from their own household’s food waste reduction to be lower than $1,500 per year, pointing to a need to raise awareness about the amount of money households could save from lessening their wasted food. In the NRDC study, 87 percent of the households surveyed agreed that reducing their household’s food waste would save money, bolstering the idea that focusing food waste reduction public education and messaging campaigns on saving money will likely resonate with consumers and could motivate a change in food wasting behaviors.
- Less than half of MITRE/Gallup survey participants (45 percent) believe that throwing away food is bad for the environment. The NRDC study came at this question a little differently, instead asking respondents to identify the potential impact of reducing their household food waste. 82 percent of NRDC respondents agreed that reducing their household’s food waste would reduce landfill use, 74 percent that it would decrease carbon emissions, 73 percent that it would save energy, and 69 percent that it would save water. Less than half of participants agreed that reducing household food waste would feed hungry people or improve the health of the household.
Studies like those conducted by MITRE/Gallup and NRDC are an important step in improving our understanding of why food goes to waste in order to identify ways to improve the problem. However, households clearly have different practices, beliefs, knowledge, and motivation regarding food waste prevention tactics. More research along these lines is needed, including studies that analyze, propose, and pilot solutions that reflect the breadth of these differences among households. Improving household food waste could have wide-reaching implications for household budgets, the bigger economy, and the climate, making this research all the more valuable.


