How Do States Distribute Federal Clean Water Grant Funds?
States take a wide variety of approaches to deciding which communities should have access to funds that support needed wastewater and stormwater infrastructure upgrades.

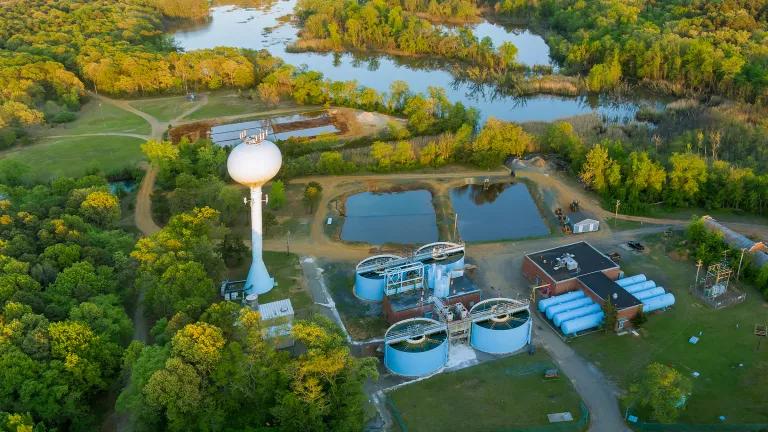
Aerial view of a wastewater treatment plant
Getty Images
It’s been a year since the passage of the Bipartisan Infrastructure Law, and funding for wastewater and stormwater infrastructure improvements is beginning to flow through the state-administered Clean Water State Revolving Fund (CWSRF) program to communities across the country.
The distribution of these funds comes with increasing scrutiny. Are the states allocating the money fairly? Are disadvantaged and underserved communities able to access it? The enduring relevance of these questions was underscored by a recent NRDC report that found inequities in the distribution of CWSRF funding over the past ten years.
States make many policy decisions in administering this funding stream, but one of the most important is establishing affordability criteria. These criteria comprise a state’s methodology for identifying which communities are eligible to receive grants or principal forgiveness instead of traditional low-interest CWSRF loans. (Note: the title of this blog post uses the term “grants” for brevity purposes, but principal forgiveness is more common. Both are types of funding, collectively known as “additional subsidization,” that doesn’t need to be repaid.) Qualifying under a state’s affordability criteria can make all the difference for a community being able to afford an infrastructure project to address its sanitation, flooding, or pollution issues.
The Environmental Protection Agency (EPA) and others have started taking a hard look at the equivalent state policies under the Drinking Water State Revolving Fund (DWSRF) program, which are known as disadvantaged community definitions. However, CWSRF affordability criteria have received less attention. This blog presents a summary of what I found after reviewing the affordability criteria currently in effect in all 50 states and identifies some questions for further investigation.
What are affordability criteria?
Before getting into the details, here’s a bit of context. The Clean Water Act requires each state to define the characteristics that qualify a community to receive additional subsidization. The law says that these affordability criteria shall “assist in identifying municipalities that would experience a significant hardship raising the revenue necessary to finance a project” and “shall be based on income and unemployment data, population trends, and other data determined relevant by the State, including whether the project or activity is to be carried out in an economically distressed area.” (That’s in 33 U.S.C. § 1383(i)(2)(A), for all the lawyers out there.)
Within this framework, states have a lot of discretion in establishing their criteria. They can look at a wide range of factors and assign different weight to them—including effectively ignoring the factors listed in the statute by giving them zero weight. Indeed, no two states use the exact same set of criteria.
In some respects, this makes sense. The demographics of each state are different, and they need to tailor their policies to reflect the needs of their potential CWSRF recipients. Yet this wide variety of approaches is also indicative of an underlying lack of regulatory guardrails; there are no strong federal safeguards in place to ensure that all states are distributing their money equitably to the communities that need it most.
Given the central importance of affordability criteria to the CWSRF program, the EPA has been encouraging states to reconsider what they have on the books. Back in March, the agency asked the states to evaluate and revise their criteria if necessary to ensure that additional subsidy is provided to disadvantaged communities to the maximum extent possible and to verify that the criteria capture both urban and rural disadvantaged communities.
Snapshot of current affordability criteria
To better understand the current regulatory landscape, this fall I reviewed all fifty states’ affordability criteria. Here’s what I found.
First, I want to clear up a common misconception. Many experts and advocates—including EPA staff—often express the assumption that states use the same factors in setting their CWSRF affordability criteria that they do in establishing their DWSRF disadvantaged community definitions. This is actually not true! Most states take different approaches to defining which communities are eligible for additional subsidization under the two programs.
Why does this matter? It means that the policies states adopt under each program need to be considered individually; we can’t look at one and assume our conclusions will hold true for the other, or advocate for improvements to DWSRF policies and not CWSRF policies (or vice versa). States’ CWSRF affordability criteria deserve our full attention, especially since more funding tends to flow through this program in an average year compared to the DWSRF.


Next, let’s look at the actual criteria states use in determining which communities have access to additional subsidization funds under the CWSRF.
Most states use between 3 and 5 factors or metrics in their affordability criteria. In general, using more factors tends to produce a more nuanced test for identifying the communities that would benefit from enhanced assistance. Criteria based on a range of indicators are more likely to account for different aspects of need—from the economic capacity of the community as a whole, to the cost burden for residents that would result from rate increases to cover debt service on a loan, to non-economic indicators such as environmental and health burdens or a history of racial discrimination.
That’s why the EPA has advised states that affordability criteria based solely on one particular factor (such as utility rates or population levels) can be barriers to equitable access to subsidy.

Once we take a look at the actual criteria states use, we can see how much variation there is among their approaches to defining affordability. The indicators currently in effect can be grouped into seven broad categories—income, poverty, utility rates, unemployment, population, local economic conditions, and demographics—with some states using factors that don’t fit neatly into one of those seven.
Unsurprisingly, since the Clean Water Act specifically calls them out, the most common categories are income, unemployment, and population. Each of these categories is reflected in the affordability criteria of 40 or more states.

We can break down these categories a bit more granularly to pinpoint the frequency of specific factors. For example, population trend (the rate at which population is increasing or decreasing) is the most common individual factor, used by 36 states.
You can click here to see a larger, more readable version of this graphic. Note that “MHI” stands for median household income.

Let’s take a closer look at one controversial factor, population size, as an example of how states can use the same metric but apply it in different ways. (Note: population size is controversial because the size of a community does not always correlate well with its financial capacity, which is more directly relevant to the community’s need for additional subsidization. The EPA identified the use of population size as a potentially problematic approach in a memo to the states earlier this year.)
Of the 18 states that use population size as a factor in their affordability criteria, nine apply it as a strict eligibility threshold, meaning that a community must be under the population size limit in order to qualify. Three states use population size as one of multiple eligibility thresholds, so a community can qualify by being smaller than the size limit or meeting another metric. Finally, six states use population size as one factor in a points matrix, so communities under the size limit can score points toward qualification, but it’s not a make-or-break requirement.
This variety of approaches is reflected across the board in states’ application of their affordability criteria. In general, using a points matrix or sliding scale approach to additional subsidization eligibility tends to be preferable to a strict “in/out” threshold approach, which can produce arbitrary results for similarly situated communities located on either side of the cutoff.


Finally, it’s also important to consider the legal mechanism states use to adopt their affordability criteria, a point on which the Clean Water Act is silent.
States can enact their criteria via their annual CWSRF intended use plan (IUP) or other standalone policy document, which is easy to update each year without a lot of process. They can do it through state regulations, which makes the criteria harder to revise because agencies must go through the proper administrative regulatory procedure. Or they can adopt affordability criteria in state statute, which is by far the most difficult to amend because it requires legislative action. This information is important for advocates who want their states to update or revise their affordability criteria.


Further research needed
The snapshot above provides us with a few key takeaways, namely that states are using a wide array of factors in their affordability criteria and applying those factors in different ways. However, it doesn’t yet tell us which states’ approaches are better or worse for ensuring equitable access to CWSRF assistance for wastewater and stormwater improvement projects.
To reach that level of understanding, a few additional areas of research would be useful. For example, experts and advocates should:
- Evaluate the geographic scope at which states apply their affordability criteria (city, county, utility service area, etc.). Evaluating the criteria at a scale that’s too geographically broad can make it difficult to identify the financial capacity of the particular community applying for CWSRF funds. That’s one reason the EPA is encouraging states to apply their criteria to include neighborhoods with affordability concerns within larger cities.
- Determine whether states are using strict “in/out” thresholds or sliding scale approaches in the application of their criteria. As discussed above, states use both approaches when determining which communities qualify to receive additional subsidization in the first instance, but they also use both for deciding how much subsidy qualifying communities will receive.
- Identify whether states place dollar and/or percentage caps on the amount of subsidy a recipient can receive. The EPA has flagged that restrictive caps are a barrier to communities that need a higher amount of subsidization in order to access assistance.
- Identify whether the affordability criteria (or other measures of affordability) are factored into an applicant’s ranking on the state’s annual project priority list.
- Most crucially for advocates, examine each individual state’s affordability-related CWSRF policies as an interconnected whole and assess how they affect the demographic profile of qualifying communities within that state.
We’ll continue pursuing these avenues of research and share more information when it’s available.
Special thanks to my colleague Sophia Osorio for helping create the graphics in this blog post!


