PJM Auction Illustrates Importance of Demand Curve Fix
Source: PJM
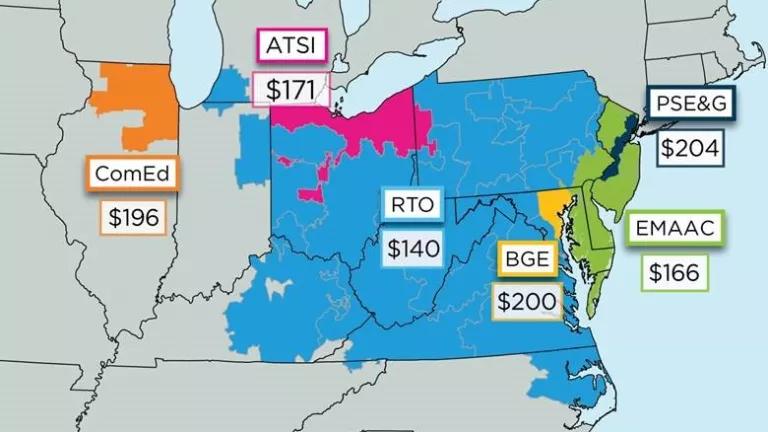
PJM, a grid operator for 65 million customers, recently conducted an auction that procured 22 percent extra capacity over its customers’ projected need. That’s more than 9,000 megawatts extra on top of PJM’s target reserve margin of 15.8 percent extra capacity. In addition to having to buy too many megawatts, many customers would have to pay twice as much for each megawatt in delivery year 2021-2022 compared to the previous delivery year.
This post continues on from the previous one to discuss how PJM can further avoid over-procuring capacity at unnecessarily high prices as it did in its latest capacity auction. The last post highlighted the Brattle Group recommendations that would help procure less capacity during the seasons when less energy is needed (while reducing market barriers to wind and solar power and lowering costs system-wide). Brattle, in a separate report commissioned by PJM, also made recommendations on how PJM can avoid costly over-procurement by adjusting its demand curve for its capacity market (pictured below). PJM will revise its capacity market demand curve this year (it’s reviewed only once every four years), and PJM’s recent auction highlights why it’s important to heed Brattle’s recommendations.

What is the VRR curve?
Unlike in other kinds of markets, PJM’s capacity market demand curve, known as the Variable Resource Requirement (VRR) Curve, is not determined by customers or their utilities deciding how much they want and at what price. Instead, PJM designs the VRR curve to procure a certain amount of capacity at each price point. The intersection of PJM’s administratively determined demand curve with the supply curve determines the price and quantity of capacity cleared through PJM’s market. Thus, the shape and position of PJM’s VRR curve impacts how many megawatts of capacity consumers must buy and at what price.
The VRR curve is supposed to procure enough capacity to meet, but not substantially exceed, PJM’s target reserve margin. A way to accomplish this is to anchor the curve at the price at which investors would be willing to add that amount of capacity. This price is known as the Net Cost of New Entry (Net CONE): it corresponds to the investment costs of an economically competitive reference technology, minus expected revenues from PJM’s wholesale electricity markets other than its capacity market. (These include PJM’s energy and ancillary services markets.) Different technologies have different Net CONEs; for example, combustion turbines require more capacity revenue than combined-cycle generators and thus combustion turbines have a higher Net CONE. Setting Net CONE too high would attract too much investment in capacity. This can happen if PJM chooses the wrong reference technology on which to base Net CONE and/or if PJM overestimates Net CONE for that technology.
PJM’s current demand curve has chronically led to capacity over-procurement
PJM’s current demand curve procures capacity beyond what is needed to maintain grid reliability standards, largely because: (1) PJM shifted the demand curve to the right (by 1 percent) to boost capacity procurement beyond that needed to meet its target reserve margin; (2) PJM assumed that high-cost gas combustion turbines would be needed to meet its target reserve margin, despite a long track record of lower-cost resources coming online; and (3) PJM overestimated the Net CONE for these combustion turbines.

As the chart shows, PJM has increasingly over-procured capacity over the past several years, and the region has no problem attracting new supply. For reference, the target reserve margins each year tend to hover around 16 percent.
How to fix the problem
To help avoid costly capacity over-procurement, PJM should at minimum follow Brattle’s advice to: (1) adopt a combined-cycle generator as the reference technology; (2) shift the VRR curve back to the left; and (3) adopt forward-looking estimates for energy and ancillary service markets to timely determine the remaining revenue needed from forward capacity markets.
Brattle offered five different candidate VRR curves below (A through F)—all of which would satisfy, and in fact on average surpass, PJM’s target reserve margin.

Source: Brattle
Brattle ultimately recommended Curve E, which would save at least $212 million annually compared to Curve A. Unlike Curve A, Curve E includes Brattle’s recommendations to adopt a combined-cycle (CC) generator as the reference technology and undo the 1 percent rightward shift of the curve from its last review. PJM implemented the shift to address the potential impact of federal regulations on retirements, which didn't actually create any problems. We are optimistic now that PJM is considering Brattle’s recommendation to eliminate that rightward shift.
PJM should adopt a combined-cycle generator as the reference technology
Part of Brattle’s recommendation is to adopt a combined-cycle generator as the reference technology instead of the combustion turbines PJM currently uses. Combined cycles have a much lower Net CONE than combustion turbines and are much more profitable to build. Nearly 27,000 MW of new combined-cycle generation came online in recent years (for delivery in 2015 – 2021), and this is the dominant technology entering PJM’s capacity market since its inception.

Source: PJM, 2018 Auction Results
Despite Brattle’s findings, PJM insists on retaining a combustion turbine reference technology. PJM argues that combustion turbines depend more on capacity revenues (because they are less frequently used), and thus it’s important that the VRR curve factors in combustion turbines’ costs. PJM also claims that the combustion turbine’s smaller exposure to energy market variations (being less frequently used) means its capacity market revenue requirements are more stable. PJM believes this insulation from energy market prices and retaining the same reference technology provides market stability.
But that reasoning is backward. The capacity market is not about ensuring that certain rarely used resources are retained and compensated. The point of the capacity market is to procure enough capacity to efficiently meet PJM’s target reserves. Resources other than combustion turbines are doing that, so there’s no reason to artificially inflate the VRR curve to retain more expensive combustion turbines. Further, there are other resources in PJM markets, like demand response, that mostly rely on capacity revenues and serve to satisfy peak demand—so combustion turbines are not unique in that regard. And while it’s important to provide regulatory certainty and avoid volatility in prices that don’t reflect the real value of capacity, markets are not intended to guarantee price certainty. True market price variability conveys useful information and can signal when it’s efficient to retire or invest in new resources.
PJM should adopt forward-looking estimates of market revenues
Capacity revenues were intended to supply money needed for an adequate level of resource investment but not provided by PJM’s other markets; thus, the VRR curve must timely reflect those other market revenues. Currently, the capacity market demand curve is adjusted based on historical revenues from PJM’s other markets. Brattle recommends adopting forward-looking estimates of these market revenues in what’s known as the energy and ancillary services (E&AS) offset. This would better represent generation developers' expectations because the amount of capacity revenues they'll need in the future depend on the revenues from other markets they'll likely get in the future, not the historical revenues.
A forward-looking approach would also mitigate any price volatility concerns. These estimates would probabilistically account for extreme events like the 2014 polar vortex, while PJM’s current 3-year historical approach exposes the market to bigger price swings based on what the weather actually does in a given year. In fact, PJM explained in its latest auction report that the higher Net CONE this time was due in part to the high energy market revenues from the 2014 polar vortex rolling off of the 3-year historical average in the E&AS offset.
Importantly, adopting forward-looking estimates can also help PJM shed some of its capacity excess. Too much capacity committed to offer in as supply in the energy market brings down energy market prices. If the VRR curve is based on these lower historical energy market revenues, PJM’s VRR curve would act to increase the capacity market revenues to reflect the lower energy market revenues. This would attract more capacity and perpetuate the cycle of oversupply. In contrast, if forward-looking estimates are adopted, and energy market revenues are expected to increase, capacity revenue and oversupply would decrease.
Unfortunately, PJM is separately proposing changes that will increase prices in its other markets without ensuring that the VRR curve timely reflects such increases. This would add to capacity over-procurement at higher prices.
PJM is taking stakeholder input through the end of August 2018, and plans to file its changes at the Federal Energy Regulatory Commission (FERC) by October 2018. While this issue is obscure, it’s important for consumer and clean energy interests to provide input to PJM and FERC.
Related Blogs

Climate Law a Game-Changer for Clean Energy in Rural America

Environmental Wins Abound in NY’s 2022 Legislative Session