Renewable Energy on Federal Lands Brings New State and County Revenues
A little-noticed provision of the One Big Beautiful Bill Act means new stable revenues for western states, but the Trump administration’s actions have limited its impact.
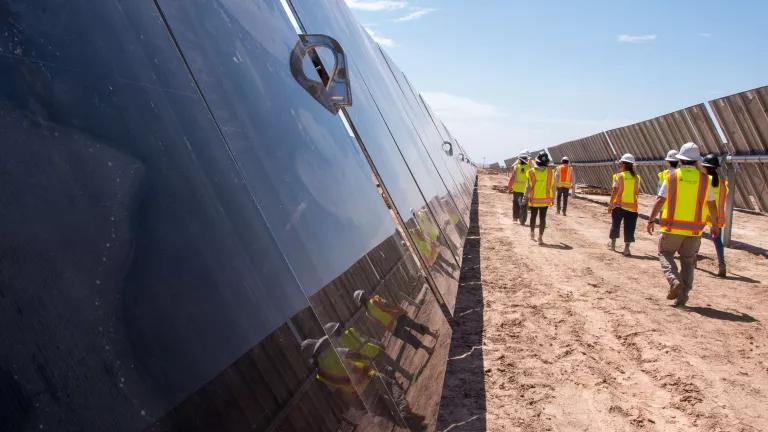
Bureau of Land Management Arizona staff walking through a construction site on White Wing Ranch private land during a site visit in Yuma County, Arizona


The enactment of the One Big Beautiful Bill Act (OBBBA), in concert with aggressive anti-renewable energy actions from the Trump administration, is set to decelerate solar deployment by eliminating or reducing tax incentives, grants, and loans enacted only years before under the Inflation Reduction Act. For projects on federal lands—primarily utility-scale solar—the loss of these financial supports, coupled with anti-renewable policies sweeping federal agencies, has essentially meant that new development has halted in its tracks and thrown into question whether federal renewable energy development can be pursued given new uncertainties around agency reviews and permit durability.
These attacks on major new energy sources come at a critical moment, as U.S. electricity demand is expected to balloon between 15–45 percent in the next decade alone, and as much as 78 percent by 2050. If this demand is not met with clean sources, we can expect to see continued entrenchment of fossil-powered energy sources, leading to exacerbated climate chaos, exposing consumers to the wild price swings of fossil fuels, and undermining domestic energy security.
A note on electricity demand estimates: Electricity demand estimates vary widely between sources, as critical emerging drivers of large loads like AI data centers present significant uncertainty. Compared to 2024 levels, expert sources like EPRI projects 14–30 percent demand increases by 2035, ICF projects approximately 35 percent demand increases by 2035 (and 78 percent by 2050), and NERC projects a cautiously high 46 percent demand increase by 2035 due to its mission of ensuring grid reliability. All agree that rates of growth are likely to be faster than what has been seen at any point previously this century.
Ironically, despite kneecapping renewable energy growth nationwide, the OBBBA established a revenue sharing system for wind and solar energy projects built on federal lands for the first time; mirroring, to some extent, the royalty system in place for oil and gas development on federal lands. Thus, for the first time, solar and wind projects on federal public lands are now generating a new and predictable income stream for three levels of government (federal, state, and county) while also diversifying and securing U.S. energy sources.
But how many projects have actually been built, and how much energy are they producing?
Due to extreme data deficiencies within the U.S. Department of the Interior’s Office of Natural Resources Revenue (ONNR) and the Bureau of Land Management (BLM), even identifying the wind and solar projects that are already built and operating on federal lands is a challenge. Despite providing extensive data coverage for things like oil, gas, coal, and a laundry list of other minerals, ONNR provides no usable data regarding bids, rents, and fees associated with renewable energy production, even as some of these projects have existed and been operating for decades and, ostensibly, paying fees—akin to royalties—to the federal government during that time.
To fill this data void, NRDC has attempted to unearth this missing data and share it with interested stakeholders. In this post, we present a preliminary analysis of operating utility scale solar projects, a small subset of the list of “permitted projects” that the BLM has compiled in a single PDF of limited utility. Based on the records available, we have identified 39 operating solar projects across four states: 24 in California, 13 in Nevada, one in Wyoming, and one in Arizona (a complete list appears at the end of this post). The net annual energy production from these 39 projects is approximately 15.3 terawatt-hours, which, according to the U.S. Energy Information Administration, is equivalent to the electricity needs of 1.44 million homes, more than 1.5 times the annual power demand of Washington, D.C. Based on nameplate capacity data and an average regional capacity factor of 26 percent from S&P, as well as a very conservative, regional average power purchase agreement (PPA) price of $25/megawatt-hour (MWh) from Lawrence Berkeley National Laboratory (adjusted for inflation to current year dollars as of July 2026), we estimate that these projects produced at least $381 million in gross energy revenues in 2025. Under the OBBBA, a portion of that value generated each year will begin to get redistributed back to states and counties in the form of capacity fees.
Revenue estimate methodology: We use a calculated average for the regions most relevant to these projects—CAISO and West (non-ISO)—across the years featured in the latest update (2023 and 2024) as a baseline assumption, resulting in a PPA price of $25/MWh, when adjusted for inflation from 2024-equivalent to current year dollars as of July 2026 using an inflation rate of 6.4 percent. Importantly, we also note this is much lower than the reported average for PPAs executed in earlier years for the same regions, making this a very conservative estimate. Source: Lawrence Berkeley National Laboratory, Utility-Scale Solar Update 2025.
Federal revenues from wind and solar projects come from two primary sources:
- Rents and fees paid prior to a project entering operations or
- Capacity fees—representing a percentage of “gross proceeds” received by the operator for the sale of electricity generated
Generally speaking, once a project enters operation, payments to the federal government will switch from annually assessed rents paid in advance to annually assessed capacity fees, paid within the first quarter of the following calendar year.
Because our research has initially focused on identifying operating projects, we’re interested in determining capacity fees due to federal, state, and county governments in 2026. The formula for determining these fees, as legislated under OBBBA, is:
Gross proceeds from the sale of electricity produced x 3.9 percent
The resulting amount is split 50 percent to the federal government and 25 percent each to the state and the county where the project is sited.
Despite the OBBBA’s passage in July 2025, there continues to be a lack of information or certainty as to when the first revenue distributions to states and counties will be made. According to BLM guidance, renewable energy operators were to submit total gross proceeds to the BLM by March 13, 2026, ostensibly to facilitate the payment of required capacity fees and onward distribution to states and counties. However, the National Association of Counties suggested in a presentation to its members that initial distributions have been delayed until March 2027 (at which point, two years of payments would be due).
To establish values for projected solar revenue, we first compiled an inventory of all built and operating solar projects on U.S. federal lands by cross-referencing industry databases, the BLM ePlanning site, the federal register, and other publicly available information shared by developers, as there is no single source of data to confirm the existence or operation of all utility-scale solar projects built on federal land. Through this effort, we were able to build an accurate snapshot of the U.S. utility-scale solar landscape on federal lands, gathering data on project nameplate capacity (MW) and average regional capacity factor (%)—two essential numbers for projecting gross annual proceeds from the sale of electricity.
Using the data we were able to collect, we estimate that the total capacity fee revenues due from all eligible, operating solar projects during the first full year, 2026, is likely to be at least $13.5 million. With revenue sharing in effect:
- 50 percent of this expected total—$6.75 million—would be retained by the federal government;
- $3.38 million would be distributed to state governments according to the share of total fees collected from projects sited in that state; and
- The remaining $3.38 million would be similarly distributed to county governments according to that county’s share of the total fees collected from eligible solar projects operations within their borders.
What follows are the annual operating performance figures for projects currently generating electricity on federal lands, including our estimates of capacity fees and projected shared revenue:
This first tranche of research was limited to determining (1) which utility-scale projects permitted by the BLM had actually been built and entered operation; (2) how much energy these projects are producing annually; and (3) how much federal revenue these projects are expected to produce, based on available information. Future research is needed to determine:
- The similar suite of operating wind energy projects on federal lands and anticipated federal revenues
- Non-generation revenues—i.e., bids, rents, and other fees—via active leases and right-of-way grants of federal lands for wind and solar development, which generate disbursable revenues under the OBBBA’s revenue sharing scheme
Non-utility-scale federal solar projects: There are several additional solar projects built on federal lands that are not utility scale and have thus been excluded from the data presented here. It is possible that they will generate capacity fees, but the amount will not be sufficient to meaningfully alter the results presented in the tables in this memo.
It is useful to note that the reported totals for 2026 revenues could be expected to be higher in future years for a number of reasons.
- We have interpreted the law to currently render three of the identified projects—Arrow Canyon and Moapa Southern Paiute in Nevada, and Centinela in California—as ineligible to generate federal capacity fees or revenue sharing due to their energy generation equipment’s precise location on private, state, and/or Tribal reservation lands; if this assessment were to change, the federal and state totals would grow or could even represent a pool of revenue to Tribal governments.
- Our simplifying assumption to model all energy revenue generation according to a single, static value does not reflect diversity in negotiated power purchase agreements between projects or regions, nor the common practice of using escalation clauses to increase values over time. In fact, comparing our modeled totals to S&P’s forecasted values for the past year of 2024 suggests we could be understating potential revenues from these projects by as much as 40–50 percent; however, it is unclear how much to attribute the difference to rates versus generation assumptions, so we choose to present our modeled estimates instead.
- Finally, there may be instances where a project presented in our results is built only partially on federal land, and therefore, only a percentage of the project’s gross revenues will be charged capacity fees. Absent clear BLM data and guidance on how this situation will be managed, we are presenting results that assume 100 percent of each project is located on federal land.
Renewable energy build-out on public lands, achieved in balance with conservation of critical ecosystem values and the interests of people who depend on them, is part of the solution to rising energy demand and decarbonizing our electric grid. The 2024 BLM Western Solar Plan PEIS identified 31 million acres of public lands for solar energy production that were prescreened for easily identifiable environmental, cultural, and social conflicts. It set the stage for efficient, smart development that’s capable of helping to meet today’s energy demand and affordability crises. And, with the passage of OBBBA’s revenue sharing provisions, this development could—if the administration were to unfreeze review and permitting processes within the BLM and other federal agencies—bring states a new, stable, long-term source of revenue, not to mention the jobs, taxes, and other benefits these sorts of projects can bring to states and local communities.
This NRDC.org blog is available for online republication by news media outlets or nonprofits under these conditions: The writer(s) must be credited with a byline; you must note prominently that the blog was originally published by NRDC.org and link to the original; the blog cannot be edited (beyond simple things such as grammar); you can’t resell the blog in any form or grant republishing rights to other outlets; you can’t republish our material wholesale or automatically—you need to select blogs individually; you can’t republish the photos or graphics on our site without specific permission; you should drop us a note to let us know when you’ve used one of our blogs.
Related Blogs

Trump Administration Readies the Axe for Nearly 45 Million Acres of Public Forests
Uncovering the Secret Documents Behind the Trump Administration's Clean Manufacturing Cancellations
