Global Greenhouse Emissions—A Good News/Bad News Story
Since the beginning of the industrial revolution global emissions of carbon dioxide – the main contributor to climate disruption – have been growing and growing (and growing). This build-up of carbon dioxide is contributing to the extreme weather events we are facing today, and the damages which will get worse if the world isn’t more aggressive in shifting from fossil fuels towards clean energy. So, it is welcome news that global emissions of carbon dioxide have plateaued for the last three years. After all, to meet the objectives of the Paris Agreement it is critical that global emissions first stop growing and then decline significantly in the coming decades.
Here are the key findings from new data released by researchers at the Netherlands Environmental Assessment Agency (see summary report and full data*).
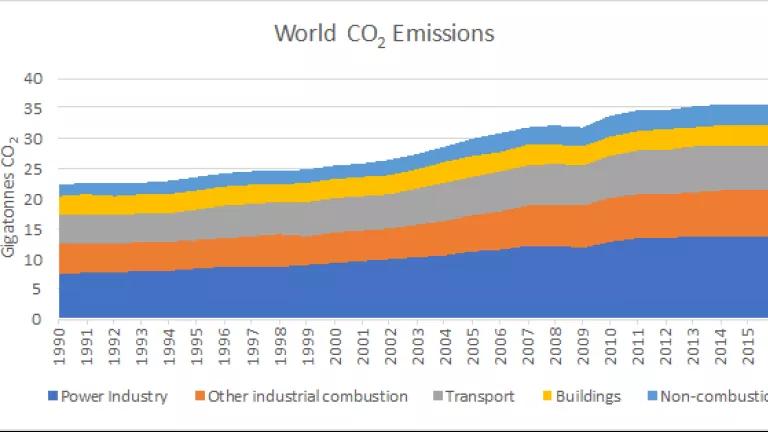
Global carbon dioxide emissions were essentially flat for a third year in a row
Prior to 2014, global emissions of carbon dioxide had been growing at a significant pace – adding roughly 0.7 Giga tons of carbon dioxide (GtCO2) per year between 2005 and 2014 (with some occasional annual variation). But between 2014 and 2016, these emissions have remained essentially flat, per this new data (see figure). Emissions fell about 0.16 percent over the 2014-2015 period and rose slightly – 0.34 percent – over the 2015-2016 period. This compares to an annual average increase from 2005 through 2013 of about two percent.
Source: Author calculation based upon EDGAR version 4.3.2.
If emissions would have continued to grow by the average rate from 2005-2013 they would have been significantly higher over the 2014-2016 period when emissions plateaued (see figure). To give some context, this plateau resulted in 3.7 GtCO2 fewer emissions into the atmosphere than if the 2005-2013 growth rate continued – equivalent to the carbon dioxide emissions of the U.S. for around 9 months.

Source: Author calculation based upon EDGAR version 4.3.2.
Major shifts are occurring in the electricity sector. This slowdown in emissions would have shocked most people a couple of years ago as analysts were projecting continued coal consumption in many of the world’s largest economies. For example, in its 2016 World Energy Outlook the International Energy Agency projected that total coal consumption will continue through 2040 under “current policies”. Power sector emissions appear to be slightly up last year (by 0.33 percent) but significantly lower than the two percent annual growth rate before 2014. So it is telling that the authors of the report conclude: “The recent slowdown in growth of CO2 is mainly the result of lower coal consumption from fuel switches to gas for power generation and increased renewable power generation”.
China’s emissions decline for second year in a row
A big driver of these changing global emissions trends is the significant shifts in China. China’s carbon dioxide emissions have declined for a second year in a row (see figure), according to this new data. Carbon dioxide emissions from all these sources declined by around 0.28 percent – a slightly smaller decrease than the previous year when emissions declined by 0.8 percent. Emissions from some of the main sectors saw even larger decreases with significant declines in the power sector (0.39 percent), transportation (0.39 percent), and buildings (0.39 percent). This data confirms the significant declines in China’s coal consumption that have occurred over the past couple of years. And the declines in transportation emissions may be early signs of the peak oil consumption that is within reach in China as the country adopts major new steps to spur electric vehicles.

Source: Author calculation based upon EDGAR version 4.3.2.
Non-CO2 gases and land-use emissions still headed in wrong direction
While carbon dioxide emissions have remained flat, the authors conclude that “in 2016, total global greenhouse gas (GHG) emissions continued to increase, by about 0.5%, 49.3 GtCO2e ”. This increase is mainly driven by the increase of non-CO2 emission (around a one percent increase) with methane emissions the largest source of non-CO2 emissions globally.
In addition, these figures don’t include emissions from land-use conversion (e.g., deforestation and forest degradation) which the authors point out would add about 4.1 Gt CO2e of emissions, bringing total global emissions in 2016 to over 53 Gt CO2e (see figure).

More action still needed
Much more action is needed in the coming years to turn the good news on carbon dioxide emissions into great news (or amazing news) in line with the significant declines necessary to put the world on a climate safe trajectory. And much more needs to be done to address emissions of non-CO2 gases and the mixed signals on forest conversion and degradation.
This new report provides some rays of hope (and some mixed signals) that the world can address climate change for the sake of the most vulnerable communities around the world and our children.
* Note this data includes carbon dioxide emissions from CO2 emission totals of fossil fuel use and industrial processes (cement production, carbonate use of limestone and dolomite, non-energy use of fuels and other combustion, chemical and metal processes, solvents, agricultural liming and urea, waste and fossil fuel fires). It excludes: short-cycle biomass burning (such as agricultural waste burning), large-scale biomass burning (such as forest fires) and carbon emissions/removals of land-use, land-use change and forestry (LULUCF).
Related Blogs

Quitting and Rejoining Global Climate Agreements: What’s at Stake for the United States
Countries Announce Continued Action on 2035 Climate Plans
