

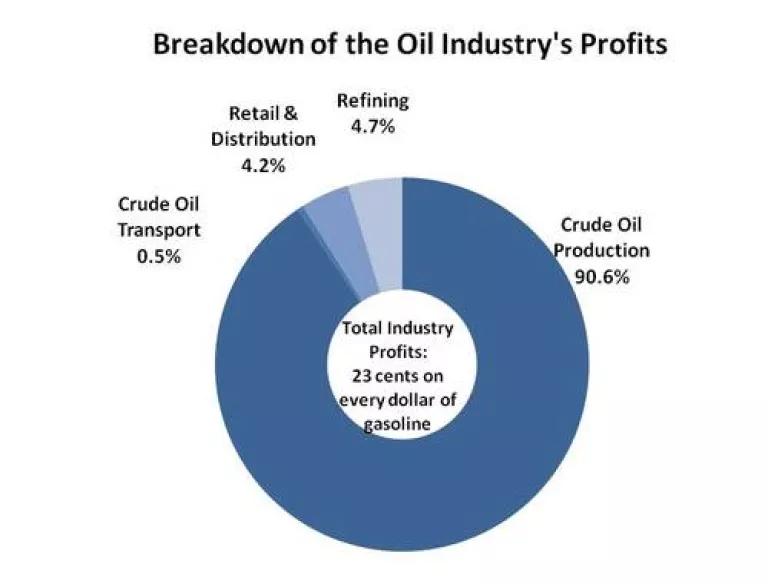
In my last blog, I posted estimates on how much of the money you spend on gas is going to the oil industry’s profits. Our updated estimate shows that 23 cents of every dollar you spent on gasoline in February went to the oil industry’s after-tax profits.[1] If you’re like the average driver, you pay about $60 to fill up your gas tank, meaning the oil industry makes about $14 in profits. [2] That’s a lot of lunches you’re buying.
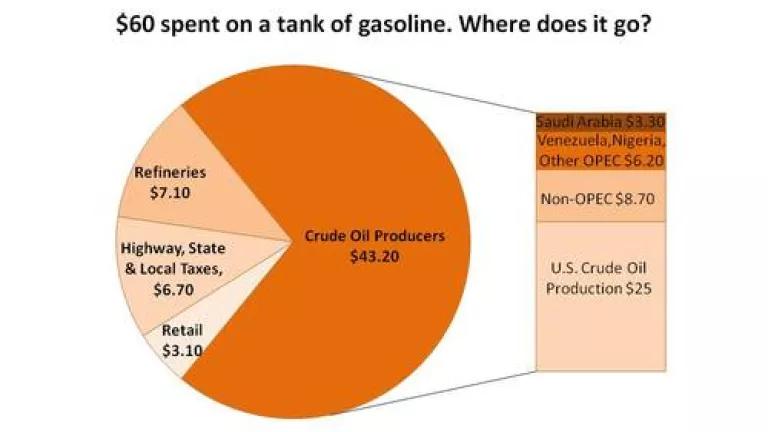
But who’s claiming your lunch money? Here is an estimated breakdown of where the $60 to fill up your gas tank actually goes.[3]
Based on data from the U.S. Energy Information Administration. Totals may not add up exactly due to rounding.
As shown in the pie chart, most of the money you spend filling your tank goes to the companies that produce crude oil. That includes not just the five majors (BP, Chevron, ConocoPhillips, ExxonMobil, and Shell) but also companies owned by foreign governments. These government-owned companies produce 73 percent of global production and control nearly 90 percent of the world’s oil reserves.[4] A sizeable fraction of your gas money is also going to the state of Saudi Arabia, Venezuela, Nigeria, and Libya as well as other countries.[5] As shown in the next pie chart, over 90 percent of the profits you send to the industry goes to the companies producing crude oil.
Collectively, that's why, as my colleague Ralph Cavanagh blogged on, there is no correlation between more U.S. oil drilling and global oil prices. The only correlation to more U.S. oil drilling is more oil industry profits. Reducing our gasoline bill means reducing oil demand and increasing supplies of cleaner, alternative fuels. This includes solutions produced right here at home, such as manufacturing more fuel efficient vehicles, making sustainably produced, advanced biofuels and shifting to cleaner electricity.
Unfortunately, American Petroleum Institute (API) – the oil industry’s lobbying group - is now claiming the industry makes only a third of its profits by excluding much of the profits from crude oil production.
The API’s claim is that oil industry profits have been “well in line with the rest of the U.S. manufacturing industry, averaging about 7 cents for every dollar of sales.”[6] This talking point is now showing up in many of the oil companies’ websites, their interviews with the press, and their multi-million dollar ad campaign. It’s no wonder that some in that media such as Forbes, Fox, and CNN are now repeating these claims.
Unfortunately for the public, API leaves out a large portion of the oil industry profits by excluding earnings from companies that supply the majors with crude oil. As we showed above, a big chunk of your money goes to those crude oil producers. Oops.[7] Even Tom Kloza of the esteemed Oil Price Information Service – considered the world’s most comprehensive source of oil pricing information – called the API’s claim “disingenuous.”[8]
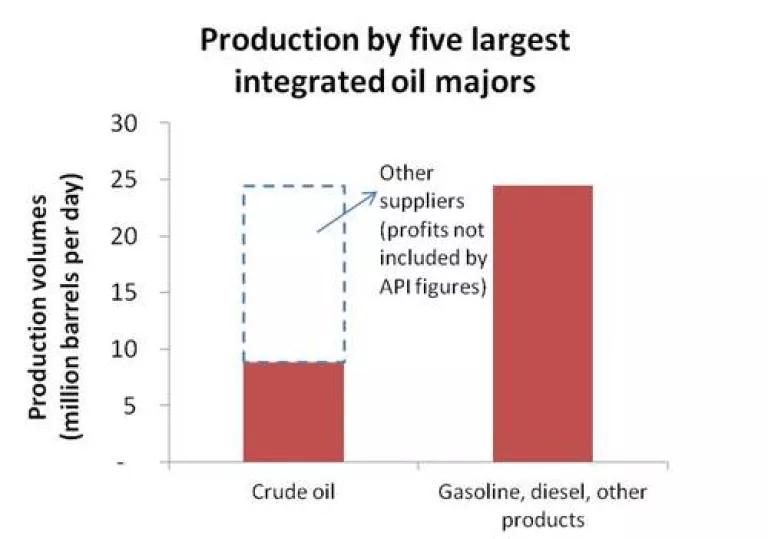
While 7 cents for every dollar in sales may go to the five majors, a lot more of your money also goes to the oil companies that supply them with crude oil, gasoline feedstocks, and even gasoline which they resell.[9] Much of the gasoline they ultimately sell to the American public comes from crude oil that is actually purchased from other oil suppliers, including Saudia Arabia’s Aramaco, Mexico’s PEMEX, and Venezuela’s PVSA. In fact, the 5 majors produce only 10% of the world’s crude oil but sell nearly 30% of the refined products.[10]
In the graph below, you can see that the five majors produce just over a third of the volume of crude oil they sell in finished products like gasoline. [11] When API counts oil industry profits, they leave out the money made from these other oil companies, cutting out a large segment of oil industry profits and giving the impression that only 7 cents of your dollar goes to the oil industry. 7 cents may go to the bottom-line of five major oil companies. But the rest goes to other oil companies in their supply chain.
Getting the numbers right on oil industry profits
How much does each segment of the oil industry make? In 2011, crude oil producers made about 30% in after-tax profit per dollar of crude oil sales.[12] The after-tax profit margin for refining the crude oil into gasoline in generally low, at about 1.3%.[13] Marketing and retail earned roughly a 1% profit margin.
Altogether, then, the entire oil industry made approximately 23 cents per dollar of sales to end-use consumers in February 2012 (or $0.84 per gallon gasoline). I have disclosed the tables and sources below showing the calculations.
That’s 23 cents of each dollar you spend on gas going to the bottom-line of the oil industry. That’s a lot of profits not counted by API.
-----------------------------------
[1] I show oil industry earnings (after taxes) throughout this blog, but include both earnings (before tax) and earnings (after taxes) in the tables at the end in order for more equivalent comparisons to API’s number. Because oil companies generally can have different tax treatments and tax shelters depending on where they locate, earnings before taxes is typically a better measure of corporate performance.
[2] Filling up on nearly 17 gallons of gasoline at about $3.58/gallon (U.S. average in February 2012) is about $60 (the average 2010 sedan holds 18.5 gallons). $0.23 in profits for every dollar spent on gasoline would be about $14 (that is, $60 x $0.23 = $14).
[3] Based on U.S. Energy Information Administration’s “March 2012: Monthly Energy Review” together with the “2011 Annual Energy Review.”
[4] Presentation by David G. Victor, University of California at San Diego, November 15, 2011, “National Oil Companies and the World Oil Market.”
[5] There is currently an oil embargo on Iran.
[6] API, “Putting Earnings into Perspective.”
[7] The 7 cents figure is also misleading because it gives the impression that 7 cents is what is paid for every dollar that end-use consumers pay for gasoline. API’s calculation includes the sales made to others in the oil industry (e.g. ExxonMobil selling crude oil to BP) as well as their sales to end consumers (ExxonMobil selling gasoline to me and you). However, all of the markups get eventually passed on to consumers. Dividing the majors’ total earnings by the finished product volumes actually purchased by end consumers would result in 11 cents in after-tax profits for every dollar spent by end use consumers.
[8] http://mediamatters.org/blog/201105120029
[9] This includes gasoline components, such as naphtha.
[10] Based on the U.S.Energy Information Administration’s International Energy Statistics and International Energy Outlook for 2011 for crude oil and natural gas liquids compared against the same as reported by the company annual reports.
[11] It generally takes a bit less than one barrel of crude oil to produce one barrel of finished products (due to refining process gains). Crude oil production volumes include both crude oil and natural gas liquids. Crude oil purchases were not reported by all five companies in their annual reports. For finished products, the majors produce finished products through their refineries, but may also purchase volumes from other refineries and resell it. The latter generally will increase sales but have little in the way of profit margins.
[12] Based on the results of the five majors annual reports. (Upstream earnings divided by revenue).
[13] As a check, we looked at other companies including those listed under Energy Intelligence Group’s Top 100: Ranking the World’s Oil Companies 2011 as well as World Bank data on the National Oil Companies. The latest data in EIG is for 2009, but generally upstream profit margins (after taxes) was 31% across 54 companies listed and for refining 6% (unweighted) across 33 companies listed. We note that for 2009, global oil prices averaged close to $60 per barrel compared to $108 in February 2012. Generally, upstream profits would be even higher in 2011 and up-to-date 2012 so our estimates may be conservative across a larger set of companies.
---------------------------------
We provide some tables for disclosure of both our numbers and sources as well as noting a correction on an under-estimate from the previous blog.

- Corrections from the last blog: In an earlier estimate, Shell’s earnings (after taxes) were used in place of earnings before taxes, leading to an underestimate of $1.12/gallon before taxes instead of $1.39/gallon figure shown here.
- The first table is taken straight from the U.S. Department of Energy's website. http://www.eia.gov/petroleum/gasdiesel/gaspump_hist.cfm
- The second table on profit margins are gathered from a number of publically available sources and purchased reports identified below.
- Note that for crude oil transport, the profit margin is multiplied by the revenue per gallon ($0.04) to derive the estimated profits. For all other segments of the supply chain, the profit margin is multiplied by the revenue from the actual fuel itself (or the price at each stage).
- For retail and crude oil transport, a U.S. corporate tax rate of 35% was used which is considered conservative. http://www.nytimes.com/2011/05/03/business/economy/03rates.html?_r=1
- The source of data includes:
Crude oil production, refining, and federal and state taxes:
- 2011 Annual Reports of the five largest oil majors
- Capital IQ
- Energy Intelligence Group Top 100: Rankings the World’s Oil Companies 2011
- Oil consultant data
- World Bank’s National Oil Companies and Value Creation, March 2011
- Congressional Research Service, “Oil Industry Profit Review,” April 4, 2008
- Department of Energy, Energy Information Administration statistics
Crude oil transport:
- Petrostrategies.org data
- http://research.banqueaudi.com/Documents/NSCSA-CompanyUpdate(Dec11).pdf
Retail and distribution:
- National Association of Convenience Stores, http://www.nacsonline.com/NACS/News/FactSheets/Motor%20Fuels/Pages/MotorFuelSales.aspx