Harmful Algal Blooms
What’s lurking in your lake? NRDC’s assessment of freshwater harmful algal bloom programs in the United States shows what states are doing—or not doing—to keep the public informed and protected.
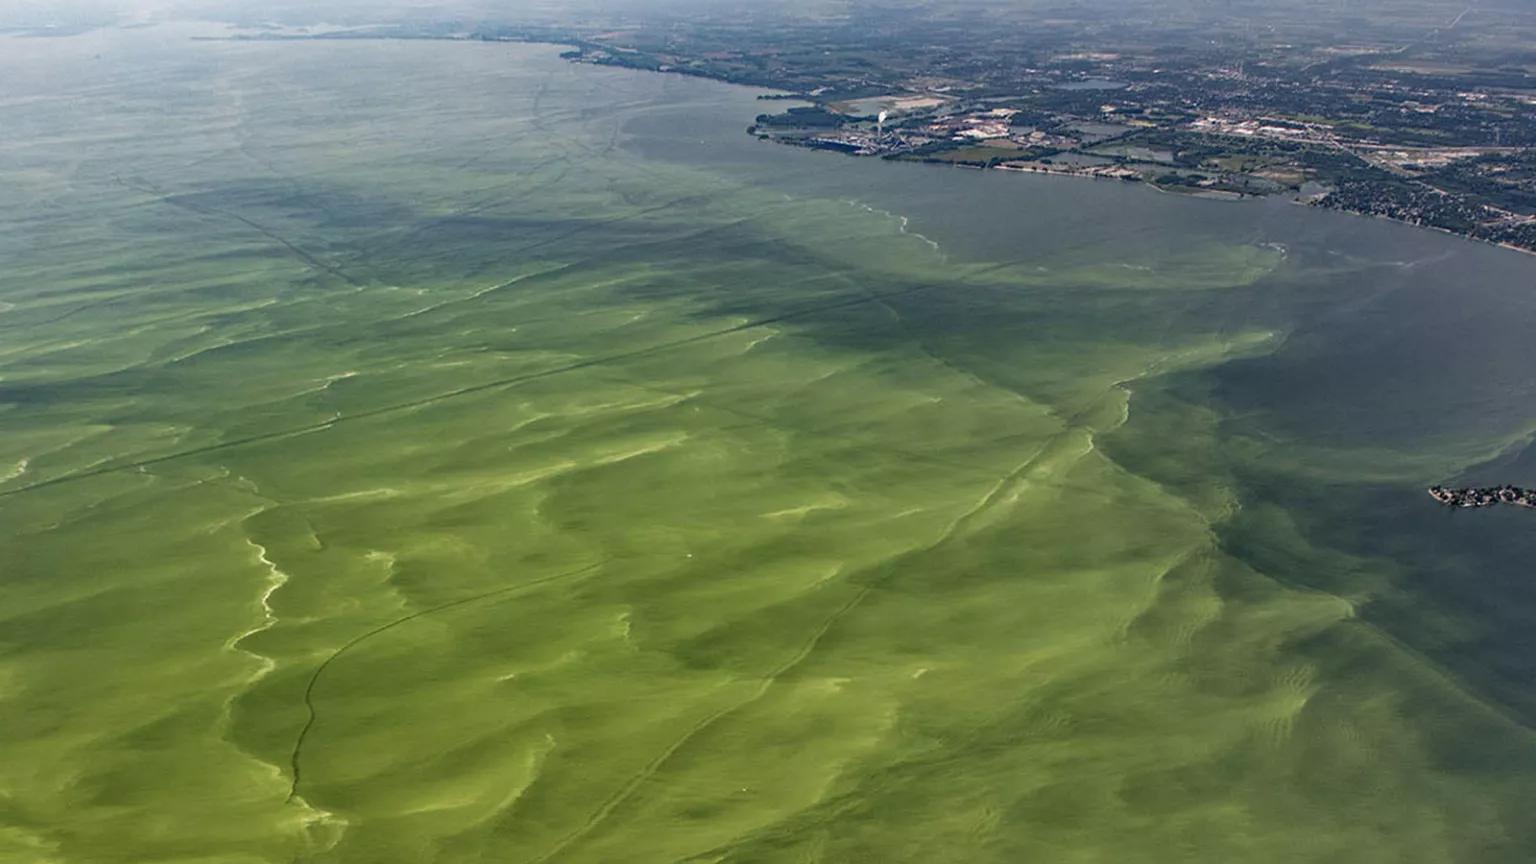
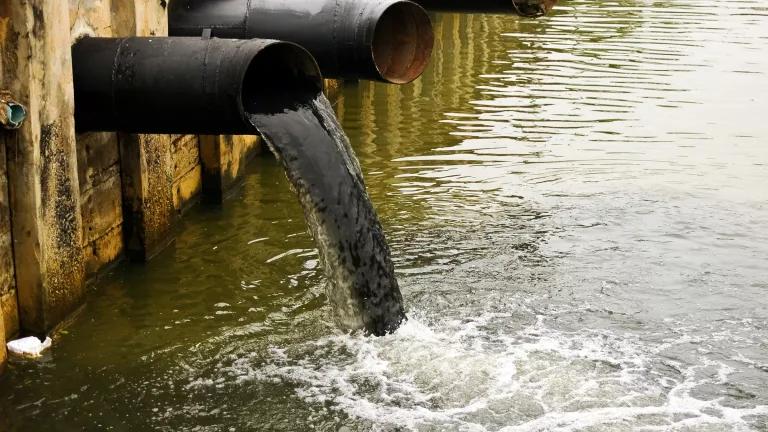
Aerial Associates Photography, Inc., by Zachary Haslick
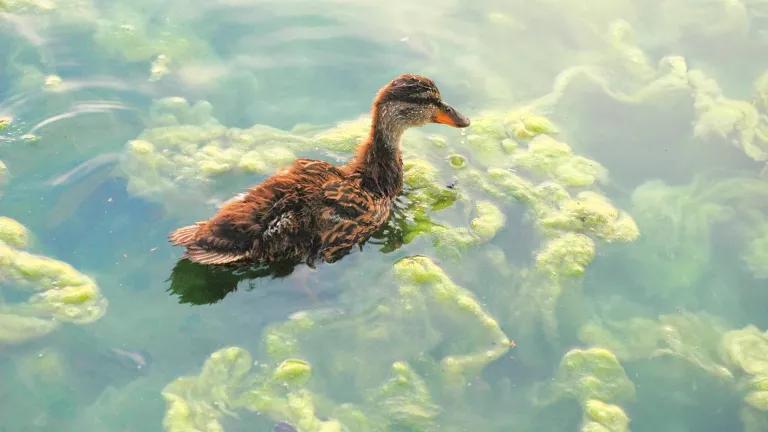
Harmful algal blooms (HABs) impact our freshwater ponds, rivers, streams, lakes, and even reservoirs. These dangerous blooms occur when cyanobacteria accumulate and produce toxins that can threaten public and environmental health. Their impacts can be severe: a fish die-off at a favorite fishing spot, a pet poisoned after drinking from a contaminated lake, children with blisters and rashes from swimming in an affected river.
Understanding why algal blooms occur and the risks they present to our families and communities is an important part of reducing and preventing their impacts.
All 50 states have experienced a freshwater HAB within the past 15 years, yet there is no national database that tracks blooms or educates the public about the increase in HAB events.
To help fill this void, NRDC asked all 50 states for their HAB data and built an interactive map that pinpoints freshwater bodies that experienced HABs between 2008 and 2020. The map also shows how well each state monitored this growing problem and alerted the public to its impacts.
Click through the map to track HABs and learn if your state is doing enough to keep the public safe and educated. Urge your governor and state legislature to adopt, support, and fund proactive approaches to monitoring and responding to these toxic threats.
What Causes Harmful Algal Blooms, and What Can Be Done About Them?
Nutrient pollution is the primary driver of HABs across the country. Sources of this pollution range from fertilizers on farmland to pet waste on city streets. Nutrients like nitrogen and phosphorus are swept up by rainwater and make their way into our freshwater ecosystems, where they stoke cyanobacteria growth. Worse yet, rising carbon dioxide levels and temperatures, coupled with periods of intense precipitation brought on by climate change, increase the likelihood of nutrient pollution—and create perfect conditions for cyanobacteria to thrive.
NRDC advocates for policies that reduce nutrient pollution and protect the quality of our nation’s freshwater ecosystems.
- NRDC promotes agricultural policies that reward farmers for embracing soil health practices like cover cropping, diversifying crop rotations, and minimizing tillage. These measures reduce the need for synthetic fertilizers and other inputs that end up running off farmland and polluting waterways.
- NRDC works in cities to encourage widespread adoption of green infrastructure, including rain gardens, green roofs, and trees—all assets that capture rainwater where it falls. Every year, an estimated 10 trillion gallons of untreated stormwater washes off paved surfaces, travels through storm sewer systems, and flows into waterways. If not adequately controlled, the high levels of nutrients in this runoff can fuel HABs.
- NRDC fights to defend the Clean Water Act—a federal law that protects water quality in the United States—from attacks by the Trump administration and industry. One such attack includes the administration’s plan to repeal the Clean Water Rule and exclude more than half of the nation’s wetlands from federal protection. Wetlands perform important ecological functions, like filtering the kinds of nutrients that cause HABs.
- NRDC collaborates with government agencies, communities, and businesses to reduce excessive diversions from rivers, streams, and lakes. In many parts of the country, diverting water for cities, agriculture, and other uses changes the natural character of waterways and creates the warm, stagnant water conditions that are ripe for HABs.
Harmful Algal Blooms: Methodology
What’s Lurking in Your Lake?
An Assessment of States’ Freshwater Harmful Algal Bloom Programs
NRDC’s 2020 data update was strictly limited to revising the map of HAB events. We did not make any changes to state scorecards. We followed the same process for collecting 2020 freshwater HAB data that we used to collect data from 2008 to 2019. For states that had previously sent us data, we asked for the same information on HAB events during 2020. For states that did not send us data in previous years, we asked whether they had data from 2008 to 2020. In this round of data collection, we did not receive information from 13 states: Alabama, Alaska, Arkansas, Connecticut, Delaware, Georgia, Hawaii, Louisiana, Maine, Mississippi, Nevada, Tennessee, and Texas.
As in 2019, we asked agency staff what thresholds states used in 2020 to issue or recommend issuing a HAB advisory. Since the EPA released new recommended recreational values for exposure to microcystin and cylindrospermopsin in 2019, many states changed their thresholds in accordance with the EPA’s guidance. Similar to our approach in the 2019 data update, we used three filtering processes:
- For states that changed their thresholds following the EPA’s 2019 recommendations, we used the new threshold to filter 2020 data sent by the state agency.
- For states that have adopted thresholds but did not change them to match the EPA’s 2019 recommendations, we deferred to the state threshold.
- For states that do not have cyanotoxin standards, we filtered data according to the EPA’s 2019 recommendations.
This year we received data from two states that had not previously provided any: South Dakota and Wisconsin. We also received more comprehensive databases from Arizona and Colorado, with information dating back to 2015 and 2014, respectively. Additionally, NRDC received data from New Mexico that had been unavailable at the time of our 2019 updates. The methods for mapping HAB events in these five states are summarized below.
South Dakota
We confirmed with state officials that South Dakota’s HAB Interactive Map is the most up-to-date source of HAB events in the state. Staff from the South Dakota Department of Agriculture and Natural Resources instructed us on how to download the data, which covers events in 2019 and 2020. Staff confirmed via email that the state recently adopted the EPA’s 2019 thresholds for microcystin and cylindrospermopsin. Prior to 2020, South Dakota evaluated HABs in accordance with the World Health Organization’s (WHO) recommended cell count levels. We filtered the 2019 data according to cell count, mapping those events where cyanobacteria count exceeded the WHO threshold for a “moderate” risk of health effects (20,000 cells/mL). For 2020 data, we mapped the events that met or exceeded the EPA’s recommended thresholds (microcystin ≥ 8 ug/L, cylindrospermopsin ≥ 15 ug/L).
Wisconsin
Wisconsin is a Home Rule state, which means that local health departments (as opposed to state agencies) have the authority to issue public health or HAB advisories. Local agencies are not required to report HAB advisories to state officials. Although the Wisconsin Department of Natural Resources (DNR) does not generally issue advisories, it does sample waterbodies as part of the Wisconsin Harmful Algal Bloom Surveillance Program. DNR evaluates sites only when human or animal illnesses linked to HABs are reported to the Department of Health Services. DNR staff sent us HAB data from 2019 and 2020, including the results of the surveillance program. Since DNR references the EPA’s 2019 thresholds on its blue-green algae website, we filtered the results according to the EPA thresholds for cyanotoxins. However, none of the HAB events sampled had cyanotoxin concentrations above the EPA’s 2019 recommended values. Thus, while we received data from Wisconsin, we did not map any HAB events in the state.
Arizona
This year we received a more comprehensive HAB data set from staff at the Arizona Department of Environmental Quality (ADEQ) that included HAB events not listed in previous responses to data requests. ADEQ provided NRDC with information about water bodies that experienced HAB events from 2015 to 2020. The data set lists HAB events that the state qualified as “toxic.” Since the data included events that had not previously been included, NRDC filtered all HAB events that ADEQ recorded as “toxic.” We identified three events in 2020 and three events from 2015–2017 and mapped those in this year’s update.
Colorado
This year we received a more comprehensive HAB data set from the Colorado Department of Public Health and Environment (DPHE), with sampling information dating back to 2014. Previously, we had only 2019 data for the state. In 2020 DPHE adopted the EPA’s recommended advisory thresholds for microcystin (≥ 8 ug/L) and cylindrospermopsin (≥ 15 ug/L) and set new standards for anatoxin (≥ 15 ug/L) and saxitoxin (≥ 8 ug/L). We filtered 2020 data according to the updated standards and mapped those events. We filtered 2014–2019 data according to the state’s previous standards (microcystin ≥ 4 ug/L, cylindrospermopsin ≥ 8 ug/L, anatoxin ≥ 8 ug/L, saxitoxin ≥ 4 ug/L) and mapped all events that met or exceeded those thresholds.
New Mexico
While the New Mexico Environment Department (NMED) was not yet ready to release the state’s 2020 HAB data, NMED staff did provide NRDC with previously unavailable 2019 cyanophyte data. Staff confirmed via email that New Mexico has not yet adopted new thresholds, so, consistent with our last update, NRDC filtered the results by cyanobacteria concentration. We mapped any events where cyanobacteria made up 38 percent or more of the total phytoplankton concentration in a sample.
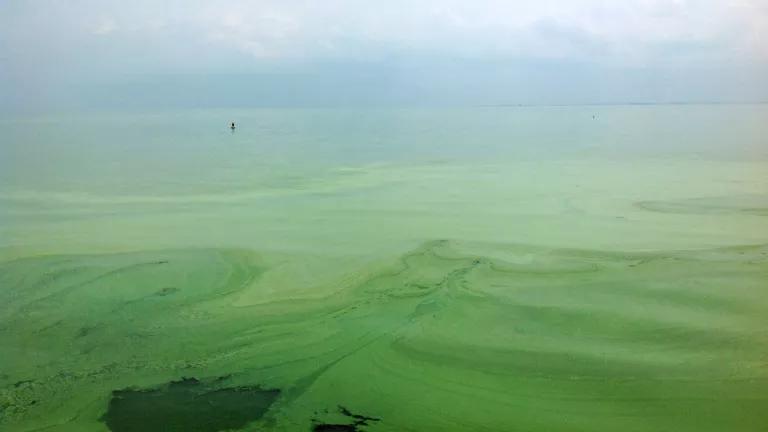
Harmful algal blooms (HABs)—a growing problem nationwide—form when some species of naturally occurring bacteria rapidly accumulate in bodies of water and produce toxins. Not only can blooms devastate coastal communities in the form of red or brown tides, but HABs in freshwater bodies damage inland ecosystems and threaten public health. Climate change is raising water temperatures, exacerbating the extreme weather events that contribute to manure and nutrient runoff, and creating favorable conditions for HABs to occur in both freshwater and marine water.
Unfortunately, the national conversation tends to ignore the threats of HABs to freshwater bodies. HABs are increasing in size and frequency, and freshwater bodies that are used for recreation—such as lakes, ponds, reservoirs, rivers, and streams—are becoming more susceptible to blooms. States recognize the need to safeguard freshwater bodies but are not responding quickly enough to adequately protect public and environmental health.
In What’s Lurking in Your Lake? NRDC conducted a two-part assessment of states’ freshwater HAB programs. The first part scores each state’s freshwater HAB program (if it has one) to determine if the state is doing enough to protect public and environmental health. The scores do not assess the quality of information made available by the state or state agency; the scores reflect only whether or not certain information is made available. The second part uses data collected by states to map HAB events from 2008 to 2018. States vary widely in the data they collect (if at all), make public, and use in determining threats to public health from exposure to HABs. While a few states are making excellent progress with their freshwater programs and developing guidelines to be more proactive in their response to HAB events, most states are still just reacting to algal blooms. This needs to change. States need to collect and use data and technology and develop more comprehensive outreach programs to proactively protect the public from exposure to HABs.
Cyanobacteria—A species of aquatic bacteria, commonly called blue-green algae, that obtain their energy from the sun using photosynthesis. Some species of cyanobacteria produce cyanotoxins, which are harmful to people—especially children—and animals. Under certain conditions, cyanobacteria can proliferate in water bodies, creating a harmful algal bloom.
Cyanotoxin—A poisonous substance produced by some species of cyanobacteria. Exposure to cyanotoxins can have adverse effects on human and animal health, including liver and kidney damage, headaches, vomiting, nausea, and stomach pains. Children and pets are more susceptible than adults to the effects of cyanotoxins.
Harmful Algal Bloom (HAB) —The rapid growth of cyanobacteria in freshwater bodies that produce toxic or harmful effects in people, animals, and ecosystems.
Freshwater Body—A water body that does not contain saltwater, including lakes, ponds, reservoirs, and rivers.
Recreational Freshwater Body—A freshwater body that is used for recreational activities like swimming, boating, fishing, picnicking, and waterskiing.
Cyanobacteria are aquatic bacteria that naturally occur in many freshwater and marine water systems. However, when conditions are favorable they can multiply rapidly and cause what is called a harmful algal bloom (HAB).1 HABs in freshwater bodies can result from a variety of factors, including elevated levels of nutrients (e.g., fertilizer runoff from farms or lawns), warm temperatures, and reduced water flows in rivers and streams.2 During a bloom, cyanobacteria may produce cyanotoxins that are harmful to people and animals, causing neurological damage, liver damage, skin irritations, and respiratory problems.3 When freshwater bodies serve as drinking water sources, the public health threat from cyanobacteria and cyanotoxins can be even more severe.4 Freshwater HABs also compromise recreational and fishing economies, costing the United States an estimated $4.6 billion annually.5
Commonly referred to as red tides and brown tides, HABs can also occur on marine coastlines and damage marine ecosystems.6 Some types of algae can leach the oxygen out of a marine zone as they die and decay, causing a condition called hypoxia. This creates “dead zones,” environments where fish and shellfish can no longer survive.7,8
The relationship between cyanobacteria and cyanotoxins is complicated. Cyanotoxins can linger in freshwater bodies even after cyanobacteria have dissipated, and just because cyanobacteria are present does not mean cyanotoxins are.9,10 This makes it difficult to know if a water body is harmful unless someone falls ill or officials conduct tests.
Every state in the United States has experienced a HAB in the past 15 years.11,12 However, the national conversation tends to ignore the dangers of HABs in freshwater bodies. Too often, inland communities do not know if the pond their kids swim in, the lake their dogs play around, or the reservoir they fish in is contaminated with harmful cyanobacteria or cyanotoxins. States should inform people about HAB events in recreational freshwater bodies by issuing advisories or warnings. They should collect and use HAB data to predict and prevent exposure to blooms and educate the public through outreach programs. However, our assessment shows that too many states are failing to collect comprehensive data, are not making information available to the public, and are behind in developing protocols to respond to HABs. This lack of outreach and action poses serious threats to public and environmental health.
States are responsible for protecting their constituents from HABs. However, different states take different approaches to fulfilling this duty, making it difficult to assess how successful they are. To evaluate states’ efforts, fill in data gaps, and empower states to learn from one another, NRDC conducted a two-part assessment of all 50 states’ freshwater HAB programs.
The first part scores what information states make available to the public, how easily the public can access and interpret that information, and whether state agencies are well equipped to proactively respond to the growing problem of freshwater HABs. The scores do not assess the quality of information made available by the state or state agency; the scores reflect only whether or not certain information is made available. The second part maps HAB events in each state using data collected by state agencies. States differ in the HAB data they collect—if they collect any at all. Even though a state’s map may not show any HAB events, this does not necessarily mean the state has not experienced a HAB. It could simply reflect a lack of data.
States should arm the public with the most recent, most thorough information possible to help individuals and families avoid exposure to HABs. We hope these state scorecards and state HAB maps empower individuals and organizations to ask governors, state legislators, and state agencies for stronger, more robust, and more proactive freshwater HAB programs.
Our scorecards focus on freshwater bodies—lakes, reservoirs, ponds, rivers, and streams—that are used for recreational activities including swimming, walking pets, boating, and fishing. We did not assess how states respond to and manage HABs in drinking water sources, because the EPA has different recommendations for how to respond to these blooms.
Description of Scorecards
With the help of experts, practitioners, and scientists, NRDC compiled a list of 32 yes/no questions to assess states’ freshwater HAB programs (see Appendix A for the complete list of questions). If the answer to a question was yes (a checkmark indicated a yes), the state earned one point. If the answer to a question was no, or if there was no response from a state agency despite repeated attempts to get one, the state did not earn that point.
We sorted questions into four categories of eight questions each. Each category was rated on a scale from “Excellent” to “Fail.”
Accessibility of Information—whether a state agency has a website that provides general information about HABs.
Response Protocol and Coordination—the internal administrative processes a state agency follows to respond to HABs.
Data Collection and Use—the type of cyanobacteria and/or cyanotoxin data collected and how the data are used to inform decisions.
Public Outreach—whether and how the state continuously educates the public about HABs.

The science surrounding HABs is constantly evolving, and methods for evaluating and testing for cyanobacteria and cyanotoxins change. The questions in the scorecard are meant to establish minimum requirements for HAB programs. Thus the scorecard does not analyze the quality of information made available, only whether information, and how much information, are presented.
Thresholds for Issuing Advisories or Warnings to Protect Public Health
In 1998 the U.S. Congress passed legislation to create an interagency working group tasked with researching and monitoring marine coastal HABs.13 In 2004 Congress reauthorized the working group to include freshwater HAB research.14 And in 2017, with HABs becoming more common and severe, the Environmental Protection Agency (EPA) used its authority under the Clean Water Act to recommend limits for safe levels of exposure to cyanotoxins in drinking water and recreational freshwater bodies.15 In its draft guideline document, the EPA recommended exposure limits for two cyanotoxins—microcystin and cylindrospermopsin—and suggested that states use these limits in determining when to issue advisories or warnings to protect public health (Figure 1).
Figure 1. 2017 Draft EPA Recommended Cyanotoxin Exposure Limits for Recreational Activities 16

EPA, “Recommendations for Cyanobacteria and Cyanotoxin Monitoring in Recreational Waters,” June 2017, https://www.epa.gov/sites/production/files/2017-07/documents/08_july_3_monitoring_document_508c_7.5.17.pdf.
Since cyanotoxins are produced by cyanobacteria, the EPA recognizes that cyanobacteria cell counts in a water body can be informative and serve as an interim step before a cyanotoxin analysis. However, the EPA does not explicitly recommend that states use cyanobacteria cell counts in issuing advisories to protect public health.17 Instead, the EPA references the 2003 World Health Organization’s (WHO) guidelines for limiting or avoiding recreational activity, which are based on the relative probability of acute health effects from different levels of cyanobacteria cell counts (Figure 2).
Figure 2. 2003 WHO Recreational Guidance/Action Levels Based on Cyanobacteria Cell Counts per Milliliter 18

EPA, “Human Health Recreational Ambient Water Quality Criteria or Swimming Advisories for Microcystins and Cylindrospermopsin—Draft,” no. 822-P-16–002 (December 2016): 185, https://www.epa.gov/sites/production/files/2016-12/documents/draft-hh-rec-ambient-water-swimming-document.pdf
These thresholds are a good start, but our scorecards reveal that EPA guidelines are not followed consistently, if at all. States either:
- follow EPA’s recommendations for cyanotoxin concentrations;
- use higher cyanotoxin concentration thresholds than EPA’s 2017 recommended levels (if so, we note this in the state’s scorecard);
- rely on cyanobacteria cell counts;
- use a combination of cyanotoxin concentrations and cyanobacteria cell counts; or
- do not have thresholds.
This inconsistency across states is problematic for several reasons. One, people are not equally protected across the country. Two, it requires individuals and families traveling across state lines for recreation to learn new thresholds. Three, states collect different kinds of data based on their own assessments of public health threats. Four, inconsistent data collection across states makes it difficult to analyze HAB trends nationwide.
Methodology
To answer the 32 questions, we searched online for state-specific websites, documents, press releases, data sets, and other public records held by state agencies (e.g., a web page titled “Iowa Harmful Algal Blooms”). If we could not find the information and data we needed on agency websites, we contacted officials from state agencies responsible for water quality, natural resources, parks, fish and wildlife, environmental protection, public health, or pollution control (e.g., a water quality manager at a state Department of Natural Resources).
Some states’ staff were more responsive than others, and we are thankful for the time state personnel spent explaining what is made available to the public and what is not. The time it took to get answers from state officials did not affect the scores for this analysis, even though it may serve as an indicator of responsiveness. All but a handful of states responded to our inquiries; in the case of nonresponses, we indicated “No response from state agency officials.”
We provided hyperlinks to all online resources we used to answer the questions. Otherwise, we prefaced descriptions of answers with “According to personal communication with agency staff.”
We did not provide hyperlinks to some of the questions in the “Data” category because the data may have been sent to us in an Excel spreadsheet. The lack of readily downloadable data is addressed in a later category of questions.
This analysis was conducted from September 2018 to May 2019. It is possible that state agencies updated websites, made additional data available, or created or changed protocol guidelines after the completion of our assessment.
There is no national database that maps HAB events across the United States. The What’s Lurking in Your Lake? state maps fill this national data gap. We asked state agencies to share HAB advisory, cyanobacteria, and cyanotoxin data. Some states pointed us to online databases where we could easily download cyanobacteria and cyanotoxin data. Most states provided HAB data in spreadsheet form. For other states, we had to submit public records requests to receive data.
How to Interpret the State Maps
Each state’s map represents the data collected by that state. We cannot guarantee that each map is comprehensive of all HAB events in that state. Just because a water body lacks a pinpoint does not mean it has not experienced a HAB—it may be that the water body has never been tested by the state. Furthermore, a map that does not display any HAB events does not mean there were no HABs in the state; the lack of pinpoints may be a result of the state’s lack of HAB data. This is the case for Alabama, Alaska, Arkansas, Colorado, Connecticut, Delaware, Georgia, Hawaii, Louisiana, Maine, Mississippi, Nevada, Oklahoma, South Dakota, and Tennessee.
Each HAB event or water quality sample above a cyanobacteria/cyanotoxin threshold is represented by a pinpoint. If you hover over the pinpoint, you can see more information about the HAB event. You can find details about the data used to map each state in Appendix B.
Data Gathering
We asked state agencies to send us a database of HAB events in their state from 2008 to 2018. We specifically asked for the names of freshwater bodies that have experienced HAB events, locations (latitudes and longitudes) of those water bodies, the type of cyanobacteria/cyanotoxin detected, cyanobacteria cell counts or cyanotoxin levels, if a public health advisory was issued, and when the advisory, if any, was lifted. States provided data in different formats, and at times it took several requests to get all the data we needed.
Most states provided the name of the freshwater body that experienced a HAB event, the year that an advisory was issued, and the reason for the advisory (e.g., cyanotoxin concentration limit was exceeded). States use different thresholds in determining when an algal bloom is harmful, including cyanobacteria cell counts, cyanotoxin concentrations, visual indicators, Secchi disk tests (a visual assessment of water clarity, which is diminished during an algal bloom), or a combination of these metrics. We relied on each state’s chosen metric when mapping harmful algal blooms in that state. If the state did not have a threshold for determining when an algal bloom is harmful, we used EPA’s 2017 draft guideline values.
Latitudes and longitudes were either provided by a state agency in response to the initial data request or supplied after a follow-up request. If coordinates were not provided in decimal degree form, we converted them into that form using the Federal Communications Commission’s online coordinate converter.19 Some states did not provide latitudes and longitudes but provided names of freshwater bodies. For missing coordinates, we used Google Maps to pinpoint the center of a freshwater body, but this does not necessarily mean the bloom occurred on the entire water body.
Data Mapping
States provided data in one of five formats:
- A spreadsheet listing when, and for what water bodies, HAB advisories were issued. We mapped where those advisories were issued.
- A spreadsheet listing when, and for what water bodies, a HAB was observed or reported. We mapped those observations and reports.
- A compilation of written documents, memos, or website pages detailing when, why, and for what water bodies HAB advisories were issued. We transcribed the information from these documents into an Excel spreadsheet and mapped those events.
- A spreadsheet of raw water quality sampling data. For these states, we filtered the spreadsheets based on the HAB threshold adopted by that state. If a state had thresholds that changed from 2008 to 2018, we filtered the data according to the threshold used for a given time period. For states that use cyanobacteria cell counts, we filtered the sample data using the state’s adopted cyanobacteria cell count threshold. For states that do not have cyanobacteria thresholds, we mapped the samples based on the World Health Organization’s 2003 cyanobacteria recommendation (≥ 20,000 cyanobacteria cells/mL). For states that collect cyanotoxin data but do not have a cyanotoxin threshold, we filtered the sample data using the EPA’s 2017 cyanotoxin guidelines and mapped those samples. (The EPA recently published its 2019 guidelines for safe levels of exposure to cyanotoxins, with thresholds that are twice as high as those in the 2017 draft.20 Our data assessments were completed before the 2019 numbers were published.)
- PDFs of water quality sample laboratory reports. For these states, we sorted through the laboratory reports and mapped events based on either the state’s HAB threshold or, in the absence of a state threshold, the EPA’s 2017 recommended thresholds.
In some states, several different agencies maintain websites that provide general harmful algal bloom (HAB) information to the public. For example, a state’s health department and its environment and natural resources department may both have HAB websites. Where this was the case, we chose one website to answer all the questions, using the site that allowed us to answer yes to the most questions in the General Information section. The website we used in our assessment is the first one hyperlinked in the “Reference” lines at the end of General Information. However, we have also provided links to all the other websites we found that offer general HAB information for that state. State agencies should reduce confusion and focus resources on a single website that can, at minimum, cover the questions posed in this section.
Accessibility of Information
(8 points total)
Is there a general state agency website that discusses:
- (1 point) What harmful algal blooms (HABs) are and why they’re harmful.
- (1 point) Where and when they are commonly found. We were specifically looking for language explaining that HABs are more commonly found during summer months in freshwater bodies like lakes, rivers, streams, ponds, and reservoirs. We still rewarded a point even if not all types of freshwater bodies were mentioned.
- (1 point) What causes the blooms.
- (1 point) Who’s at risk? Highlighting the risks to people is important. With this question, we specifically looked for language that states that pets AND children are more susceptible to the effects of harmful algal blooms.
- (1 point) Does the website provide photographs of what a harmful algal bloom looks like?
- (1 point) Does the website explain what the public should do if they see a bloom? We were specifically looking for language like “Stay out of the water,” “Do not go into the water,” “Do not consume fish from contaminated water,” and “Do not boil water for consumption.”
- (1 point) Does the website describe how to contact someone if a constituent does see a bloom?
- (1 point) Does the website discuss what can be done to reduce the likelihood of local harmful algal blooms in a community’s freshwater bodies?
Reference: If available, this is where we provided links to one or more state-sponsored websites.
Response Protocol and Coordination
(8 points total)
Response Protocol
- (1 point) Has the state adopted any kind of threshold for unsafe algal toxin levels (including U.S. Environmental Protection Agency [EPA] recommended recreational thresholds)? We recognize that some states use cyanobacteria cell counts as indicators for whether to issue an advisory. Since cyanobacteria cells can be present but not producing cyanotoxins, and since cyanotoxins can be present even if cyanobacteria cells are not, we specifically wanted to know if the state has adopted standards for unsafe toxin levels, because cyanotoxins are harmful to public health. The EPA recommends advisory thresholds for two cyanotoxins—microcystin and cylindrospermopsin. Since the former is the most common cyanotoxin detected in freshwater bodies, we awarded a point if the state has, at least, a microcystin threshold. If the state’s threshold is higher than the EPA’s 2017 recommended advisory threshold, we mentioned this in an asterisked statement like the one below.
**State X’s cyanotoxin threshold(s) is/are higher than the EPA’s recommended threshold(s)**
- (1 point) Does the state have a strategy or protocol in place that details how to respond to a HAB complaint/report? We wanted to know if the state has a document that details how its agencies respond to complaints or reports of HABs. If there are multiple agencies responsible for HAB issues in the state, does the response document identify what each agency’s responsibilities are? Does the strategy include information about when to issue advisories and when to post signage? Does the strategy include information about how to communicate HAB events to the public? We believe it is important to have a document that details the process for responding to HABs so the public can learn what to expect from state agencies and which agencies to hold accountable in case events are not communicated.
- (1 point) Does the state government provide dedicated financial support for HAB response? We wanted to know if the state agency receives funding from the state to support response activities (e.g., money for test kits, lab analyses, signage, and so on).
- (1 point) Does the state have an agency (or agencies) with the authority to issue a public health advisory for freshwater bodies? In some states, state agencies do not issue public health advisories because it is not an authority explicitly granted to them. We wanted to know if a state agency can issue public health advisories, or if the authority to issue advisories rests with counties, cities, towns, or local water body managers. Local entities may be constrained by resources and awareness, making it less likely that an advisory will be issued. Granting state agencies the authority to issue advisories helps officials detect patterns of HABs across the state, standardize response, and protect public and environmental health on a wider scale. We did not have the capacity to research whether agencies who have advisory authority acted on that authority.
- (1 point) Can any governmental entity issue information about the risks of recreating on or in a freshwater body? This question is broader than the previous one. Information can come in the form of an advisory, but it can also include things like signs describing what harmful algal blooms look like, photos illustrating what kinds of algal scum are potentially harmful, instructions for how to report suspicious algae to an appropriate agency, and what kinds of recreation should be limited during a bloom. We asked agency officials if any level of government (counties, cities, towns, or the state) can proactively disseminate information about HABs on or in a recreational freshwater body.
Agency Coordination
- (1 point) Do agencies communicate and coordinate with each other through an interagency working group?
- (1 point) Is it clear which agencies or interagency working group oversees HAB-related issues for the state? NRDC answered this question using publicly available documentation. Does a state’s HAB response/guidance plan clearly show which agency manages HABs in the state? If not, then does a Google search yield this information?
Research
- (1 point) Does the state receive or provide dedicated funding to research HAB-related issues?
Data Collection and Use
(8 points total)
NRDC communicated with HAB scientists, experts, and academics to determine what a comprehensive HAB data set should, at the very least, contain. With their expertise, we determined that a comprehensive HAB data set includes: the names of freshwater bodies that have experienced HAB events, locations (latitudes and longitudes) of those water bodies, types of cyanobacteria/cyanotoxin detected, cell counts/toxicity levels, if a public health advisory or notification was issued, and when an advisory was lifted.
- (1 point) Does the state collect comprehensive HAB data? We awarded the point if the data set available online, or directly sent to us, includes all the points listed above.
Knowing that historical data help a state agency better predict, monitor, and respond to HAB trends, how far back do the data go? Points are meant to sum. The three questions below serve as a proxy for measuring how proactive states have been with their data collection. The amount of historical data a state has gathered is an indicator for how long a state has paid attention to the national HAB conversation and can show how long a state has tried to analyze trends and patterns, thereby informing its research and response needs. This question does not address how comprehensive the data are, but rather how much data a state has collected or provided to NRDC.
- (1 point) Did the state provide at least 2 years of historical data?
- (1 point) Did the state provide at least 5 years of historical data?
- (1 point) Did the state provide at least 10 years of historical data?
- (1 point) Are quantitative cell counts and/or toxin concentrations used to issue public advisories or warnings?
- (1 point) Are visual indicators of cyanobacteria used to issue advisories or warnings?
Regularity of Data Collection
(1 point) Does the state proactively sample recreational freshwater bodies for cyanobacteria and/or cyanotoxins? We looked at whether a state agency proactively tests recreational freshwater bodies for cyanobacteria or cyanotoxins during peak recreational summer months (roughly from May to September). We did not have the capacity to review how thorough a state’s proactive monitoring program is (e.g., what proportion of all the freshwater bodies in the state are sampled). We awarded a point for water samples that are analyzed at a laboratory (e.g., using ELISA tests) for cyanobacteria or cyanotoxins during routine monitoring. We did not award a point for visual assessments.
(1 point) Does the state sample recreational freshwater bodies for cyanobacteria and/or cyanotoxins during and after a bloom?
Public Outreach
(8 points total)
Public-Facing Information
(1 point) Does the state provide a map that allows members of the public to see/learn more about HAB events near their communities or at freshwater bodies they recreate on or in?
- (1 point) Can the public easily access historic and recent HAB advisory data, through either an online database or an open source platform?
- (1 point) Are easily interpretable test result summaries made available to the public shortly after sample results are available?
- (1 point) Is the state’s HAB guidance document or response protocol available online?
Outreach Strategy
(1 point) Does the state publicly explain what metrics and thresholds the responsible agency uses in determining whether a bloom is harmful to public health?
- (1 point) Is there evidence of a state agency communicating HAB information to the public? We sought to find at least one example of a press release, press statement, or tweet issued within the past two years by any of the state agencies mentioned in the scorecard to inform the public about HABs.
- (1 point) Does the state leverage non-state resources to communicate HAB information to the public (through NGOs and/or local nonprofits)? We wanted to know if a state agency works with nonprofit organizations (national or local) or any kind of local entity in disseminating information to the public.
Public Report Process
(1 point) Is there a clear way for a member of the public to file a complaint, send a photograph, or request a toxin test if a freshwater body looks like it is experiencing a HAB? This is a more specific question than the one we posed in the General Information section. We specifically want to know if there is a way for someone to report a HAB or submit a HAB complaint, not just contact an agency official for more information.
Download the completed scorecards here, organized alphabetically by state.
Alabama
We reached out to staff at the Department of Environmental Management and asked for a database of HAB events in Alabama from 2008 to 2018. Staff said they do not have such a database and recommended we contact the Department of Public Health (DPH), which we did. DPH staff responded and said they do not have any freshwater HAB data to share. Hence, there were no data to map for Alabama.
Alaska
We reached out to staff at the Department of Environment and Conservation and asked for a database of HAB events in Alaska from 2008 to 2018. Staff said they do not have a database of HAB events. Hence, there were no data to map for Alaska.
Arkansas
We reached out to staff at the Department of Environmental Quality and asked for a database of HAB events in Arkansas from 2008 to 2018. Staff said they do not have a database they could share. Hence, there were no data to map for Arkansas.
Arizona
We reached out to staff at the Department of Environmental Quality and asked for a database of HAB events in Arizona from 2008 to 2018. Staff informed us that their current water quality database is limited but that their surface water monitoring team has collected some cyanotoxin data. Staff filtered microcystin data from their water quality data portal and sent an Excel spreadsheet to us. The data set contained HAB information from 2015, 2016, 2017, and 2018. We filtered the data according to the state’s thresholds and mapped the events that met or exceeded those thresholds.
California
We reached out to staff at the State Water Resources Control Board and asked if the HAB Incident Reports Map and the HAB Data Viewer are the most comprehensive HAB data sets in California. Staff confirmed that the two data portals contain the most comprehensive HAB data. We downloaded the Incident Reports data, sorted all the events that were confirmed blooms, and mapped the events. We also downloaded the three data sets from the HAB Data Viewer and mapped all the events that had a caution, warning, or danger advisory level.
Colorado
We reached out to staff at the Department of Public Health and Environment and asked for a database of HAB events in Colorado from 2008 to 2018. Staff said they do not have data to share. Hence, there were no data to map for Colorado.
Connecticut
We reached out to staff at the Department of Energy and Environmental Protection and asked for a database of HAB events in Connecticut from 2008 to 2018. Staff said they do not have a comprehensive list of HAB events to send. Hence, there were no data to map for Connecticut.
Delaware
We reached out to staff at the Department of Natural Resources and Environmental Control and asked for a database of HAB events in Delaware from 2008 to 2018. Agency staff informed us that they do not keep a database of HAB events. Hence, there were no data to map for Delaware.
Florida
We reached out to staff at the Department of Environmental Protection and asked for a database of HAB events in Florida from 2008 to 2018. Staff sent us spreadsheets of the water quality sample data that they use to populate their HAB map from 2016 onward. Florida has not adopted any cyanotoxin or cyanobacteria thresholds. We filtered the sample data using EPA’s 2017 recommended levels and mapped the samples that met or exceeded the threshold.
Georgia
We reached out to staff at the Environmental Protection Division and asked for a database of HAB events in Georgia from 2008 to 2018. Staff said they do not have a database of HAB events. Hence, there were no data to map for Georgia.
Hawaii
We reached out to staff at the Department of Health and asked for a database of HAB events in Hawaii from 2008 to 2018. Staff said they do not have a database of HAB events. Hence, there were no data to map for Hawaii.
Idaho
We reached out to staff at the Idaho Department of Environmental Quality for any HAB sample reports from 2008 onward. Agency staff asked that we submit a Public Records Request, which we did. We received laboratory data reports from 2015 to 2018. We mapped every sample that showed a microcystin concentration ≥ 4μg/L or a microcystis cell count ≥ 20,000 cells. We used Google Maps to get the coordinates of the center of each water body; the pinpoints for Idaho may not be positioned where the actual sample was taken.
Illinois
We reached out to the Illinois Environmental Protection Agency and asked for a database of HAB events in Illinois from 2008 to 2018. Staff sent us microcystin data from 2013, 2015, 2016, 2017, and 2018. For 2013, 2015, and 2016, we mapped the microcystin samples equaling or exceeding the 20 μg/L threshold. For 2017 and 2018, we mapped the microcystin samples that were ≥ 4 μg/L.
Indiana
We reached out to staff at the Department of Environmental Management and asked if its cyanotoxin test results website has the most comprehensive HAB data set for Indiana. Staff confirmed that the website is the most comprehensive source for data. We downloaded all the cyanotoxin reports from 2012 to 2018, filtered the data according to Indiana’s cyanotoxin thresholds, and mapped the samples that met or exceeded these thresholds.
Iowa
We reached out to the Iowa Department of Natural Resources and asked for a database of HAB events in Iowa. Staff said they do not have a database that tracks HABs in the state. They do, however, store all microcystin data on their public database. Staff told us how to download the data: We clicked on “Data Search—select search parameters to get the data you need.” We selected “21IOWA” for the facility, “Results—by Project/Task” for the query “Beach—Beach Monitoring at State-Owned Beaches” for the project, and “All Available Analytes” for the analytes. We selected data from 2008 to 2018 and downloaded the CSV file that populated. We filtered the “colMethod” column for samples using the “BEA002” collection method, and mapped all the microcystin samples that equaled or exceeded 20 μg/L, which is the state-adopted threshold.
Kansas
We reached out to staff at the Department of Health and Environment (DHE) and asked for a database of HAB events in Kansas from 2008 to 2018. Staff explained how to download historical data. We clicked on DHE’s interactive map viewer, and on the bottom of the screen, we clicked the “Options” tab and exported all the data to a CSV file. We filtered the data according to the state’s HAB thresholds (≥4 μg/L for microcystin, or ≥ 80,000 algal cells), and mapped those samples. DHE’s database dates back to 2010.
Kentucky
We reached out to the Energy and Environment Cabinet (EEC) and asked for a database of HAB events from 2008 to 2018. Staff said they do not keep such a database, but they do gather limited data when EEC receives reports of possible HABs. They also informed us that they have cyanotoxin data. Staff asked that we submit a Public Records Request, which we did. We received cyanotoxin data from 2014 to 2018 and mapped the events in which samples exceeded the state’s cyanotoxin threshold. We also received a spreadsheet detailing when advisories were issued. We cross-referenced the advisory spreadsheet with the cyanotoxin data, and mapped any advisories that were not addressed in the cyanotoxin data. .
Louisiana
We reached out to staff at the Department of Environmental Quality and asked for a database of HAB events in Louisiana from 2008 to 2018. Staff said they do not have such a database. Staff also checked with the state Department of Health, which also has no HAB database. Hence, there were no data to map for Louisiana.
Maine
We reached out to staff at the Department of Environmental Protection and asked for a database of HAB events in Maine from 2008 to 2018. Staff said they do not have a database of HAB events. The state does publish a list of lakes that have a high likelihood of producing a HAB event. However, since the list is not based on real-time water quality data, we did not map the listed lakes. Hence, there were no data mapped for Maine.
Maryland
We reached out to staff at the Department of Natural Resources and at the Eyes on the Bay program and asked for a database of HAB events in Maryland from 2008 to 2018. Staff provided us with a list of the names of freshwater bodies where HAB events occurred from 2009 through 2018, the number of advisories issued on those water bodies, the microcystin concentrations at the time the advisory was issued, and the latitudes and longitudes for half of the water bodies. We mapped all the water bodies where an advisory had been issued.
Massachusetts
We reached out to the Department of Public Health (DPH) and the Department of Environmental Protection (DEP) and asked for a database of HAB events in Massachusetts. DPH staff shared a database of freshwater bodies for which DPH had recommended an advisory from 2009 to 2018. We followed up and asked for latitude and longitude information, which staff also provided us. We mapped all the locations where an advisory had been recommended.
Michigan
We reached out to the Department of Environmental Quality and asked for a database of HAB events in Michigan from 2008 to 2018. Staff sent us cyanobacteria sample data from 2017 and 2018. We filtered the data and mapped the samples that were ≥ 20 μg/L for microcystin.
Minnesota
We reached out to the Minnesota Pollution Control Agency (MPCA) and asked for a database of HAB events in Minnesota from 2008 to 2018. Staff told us they have a database where HAB complaints received since 2004 are logged. We sorted through that spreadsheet and mapped bloom and illness reports from 2008 onward. Furthermore, staff informed us about microcystin data that are available through MPCA’s Environmental Quality Information System (EQuIS). Staff exported and sent us microcystin data from 2005 to 2018. Since the state has not adopted cyanotoxin thresholds, we filtered the data for microcystin samples ≥ 4 μg/L and mapped those samples.
Mississippi
We reached out to staff at the Public Affairs Department and asked for a database of HAB events in Mississippi from 2008 to 2018. Staff recommended that we contact the Department of Environmental Quality (DEQ), which we did. DEQ staff said they do not have a database of freshwater HAB events in Mississippi. Hence, there were no data to map for Mississippi.
Missouri
We reached out to staff at the Department of Natural Resources (DNR) and asked for a database of HAB events in Missouri from 2008 to 2018. Staff sent data from 2010, and from 2012 through 2018 with the names of the water bodies where a HAB was reported. . Staff provided latitude and longitude coordinates after a follow-up data request. We mapped all the data that were sent to us.
Montana
We reached out to the Department of Public Health and Human Services (DPHHS) and asked for a database of HAB events in Montana from 2008 to 2018. Staff said they do not have a historical database but that, for 2017 and 2018, DPHHS collected public reports of HABs. We mapped only 2018 data because it wasn’t until 2018 that HAB reports were visually verified by staff.
New Hampshire
We reached out to staff at the Department of Environmental Services and asked for a database of HAB events in New Hampshire from 2008 to 2018. Agency staff sent Excel spreadsheets with cyanobacteria data from 2017 and 2018. The spreadsheets also mention whether an advisory or warning was issued. We mapped all the data where an advisory or a warning was issued.
New Jersey
We reached out to the Department of Environmental Protection (DEP) and asked for a database of HAB events in New Jersey from 2008 to 2018. Staff said they have limited HAB data starting in 2013. They sent us a list of water bodies where a water sample confirmed a HAB event from 2013 to 2018, and we mapped all those events.
New Mexico
We reached out to the Environment Department and asked for a database of HAB events in New Mexico from 2008 to 2018. Staff said they do not have a centralized HAB database, but they do have cyanophyte data that can be used as indicators of HAB events. We were asked to fill out a data request form, which we did. We received a summary spreadsheet and supporting data on HABs in New Mexico’s lakes and reservoirs from 1994 to 2018. We were told that any time cyanobacteria constitute 38 percent of the total phytoplankton concentration in a sample, the Environment Department responds to that water body as a contaminated, nutrient-impaired water body. We mapped only the sample results where cyanobacteria met or exceeded 38 percent of the total phytoplankton concentration, from 2008 onward.
New York
We reached out to the Department of Environmental Conservation (DEC) and asked if the department’s HABs Archive Page contains the most comprehensive state HAB data. Staff confirmed that the DEC website is the most comprehensive. Staff also sent us a spreadsheet of all the water bodies for which advisories were issued from 2012 to 2018; the spreadsheet contained the water body name, the county it is in, and its coordinates. We downloaded DEC’s 2012–2018 summary PDFs from its HABs Archive Page and transcribed the information to an Excel spreadsheet. We mapped the 2012–2018 HAB events that were designated as “C” (confirmed bloom—where water sampling showed the presence of cyanobacteria that could produce cyanotoxins) and “HT” (high toxins—confirmed elevated levels of cyanotoxins).
Nebraska
We reached out to the Department of Environmental Quality and asked if the department’s sampling results data website is the most comprehensive collection of HAB data in Nebraska. Staff confirmed that it is. Staff sent us microcystin data from 2008 to 2018. We mapped all the locations where samples met or exceeded the 20 μg/L microcystin threshold adopted by the state.
Nevada
We reached out to staff at the Division of Environmental Protection and asked for a database of HAB events in Nevada from 2008 to 2018. Staff said they do not have such a database. There are no data to map for Nevada.
North Carolina
We reached out to the Department of Environment and Natural Resources and asked for a database of HAB events in North Carolina from 2008 to 2018. Staff shared the data set that is used to populate the state’s Online Algal Bloom Map. Staff provided data from 2012 to 2018, and we mapped all the instances where a bloom was designated a harmful cyanobacteria bloom.
North Dakota
We reached out to the Department of Health and asked for a database of HAB events in North Dakota from 2008 to 2018. Staff said the state does not maintain a database of lakes with HAB advisories or warnings. They did provide an Excel spreadsheet with all the lakes that had advisories issued in 2016, 2017, and 2018. We mapped all these lakes.
Ohio
We reached out to staff at the Environmental Protection Agency and asked for a database of HAB events in Ohio from 2008 to 2018. Staff sent a spreadsheet of microcystin sample data from 2000 to 2018. We filtered the spreadsheet and mapped the microcystin samples that met or exceeded the state’s threshold of 6 μg/L.
Oklahoma
We reached out to staff at the Department of Environmental Quality and asked for a database of HAB events in Oklahoma from 2008 to 2018. Staff said they do not have such a database but recommended that we contact the Oklahoma State Parks (OSP) program to ask for data. However, OSP staff said they do not keep data either. There are no data to map for Oklahoma.
Oregon
We reached out to the Oregon Health Authority (OHA) and asked if the agency’s Cyanobacteria Advisory Archive is the most comprehensive collection of HAB data in the state. Staff confirmed that it is. Staff also sent us a summary of all the advisories issued from 2007 to 2018. (From 2008 to 2013, cyanobacteria cell counts were used to issue advisories; from 2014 to 2018, cyanotoxin concentrations were used.) We cross-referenced the summary document and the advisory information available on the online archive. In a follow-up email we requested latitude and longitude data, which staff provided. We mapped all the advisories listed from 2008 to 2018.
Pennsylvania
We reached out to staff at the Department of Environmental Protection (DEP) and asked for a database of HAB events in Pennsylvania from 2008 to 2018. Staff said DEP does not have a database of HAB events, but they sent microcystin sample data for lakes and streams from 2009, 2011 to 2014, and 2016 to 2018. DEP also sent us an Access Database with 2018 cyanotoxin sample data. We asked staff to run a query in the Access Database and send us data on the samples that met or exceeded EPA’s cyanotoxin thresholds. We combined the data sets and mapped the samples where the microcystin threshold was ≥4 μg/L and the threshold for saxitoxin, another harmful cyanotoxin, was ≥0.8 μg/L.
Rhode Island
We reached out to the Department of Environmental Management and asked for a database of HAB events in Rhode Island from 2008 to 2018. Staff sent a cyanotoxin and cyanobacteria cell count summary document with data from 2011 to 2018. From 2010 to 2017, Rhode Island used a 14 μg/L microcystin threshold and, from 2017 onward, a 4 μg/L microcystin threshold. We mapped the samples that met those criteria.
South Carolina
We reached out to the Department of Health and Environmental Control (DHEC) and the Department of Natural Resources (DNR) and asked for a database of HAB events in South Carolina from 2008 to 2018. DHEC staff said they do not have a specific HAB database. The only HABs that are investigated and tracked are those that are submitted as fish kill complaints. DHEC staff redirected our data request to the fish kills department, and staff sent us a database of fish kill complaints from 1999 to 2009. We examined the database and found a handful of fish kill complaints associated with blue-green/cyanobacteria events. However, none of those events were in 2008 or 2009. DNR staff also responded and said that they, too, lack a comprehensive list of HAB events in South Carolina. They sent cyanobacteria data from sampling on Kiawah Island from 2011 to 2016. We mapped all the samples where DNR noted that cyanobacteria were likely present at bloom concentrations.
South Dakota
We reached out to staff at the Department of Environment and Natural Resources and asked for a database of HAB events in South Dakota from 2008 to 2018. Staff said they do not have a database of HAB events and do not monitor for cyanotoxins. Hence, there were no data to map for South Dakota.
Tennessee
We reached out to staff at the Department of Environment and Conservation (DEC) and asked for a database of HAB events in Tennessee from 2008 to 2018. Staff informed us that they have limited cyanobacteria data. They told us that DEC did some cyanobacteria testing during the summer of 2017 but did not detect any cyanotoxins in those samples. We requested the 2017 data, and staff shared it with us. We examined the data and did not find any samples that exceeded the state’s thresholds. DEC staff recommended that we contact the Tennessee Valley Authority (TVA) for additional information. TVA staff told us they do not have any HAB data for the water bodies they manage. Hence, there were no data to map for Tennessee.
Texas
We reached out to the Texas Commission on Environmental Quality (TCEQ) and asked for a database of HAB events in Texas from 2008 to 2018. Staff recommended that we reach out to the Parks and Wildlife Department (TPWD). We did. TPWD staff said they do not have a HAB database, but that their fish kill database might have cyanobacteria information we could use. Staff sent us a database of fish kills related to cyanobacteria. The database consisted of HAB events from 1994, 1997, 2002, 2006, 2008, and 2017. We mapped only the events from 2008 and 2017.
Utah
We reached out to staff at the Department of Environmental Quality and asked for a database of HAB events in Utah from 2008 to 2018. Staff said that the state’s HAB program had been fully deployed in 2016, and they directed us to a water quality website to collect HAB advisory data from 2014, 2016, 2017, and 2018. We reviewed all the water bodies listed under each year’s Monitoring Dashboard and gathered data on waterbody name, date, and type of HAB event. We mapped all the events where a HAB was confirmed from either a visual analysis or a cyanotoxin test.
Vermont
We found summaries of HAB advisories on the Department of Health and Environment (DHE) website and sent an email asking staff to confirm that this was the only place where we would find information about HAB events in Vermont. Staff confirmed, and we downloaded data by clicking on the season summary for each year and then clicking on the download hyperlink for that year. At the time, Vermont had summary data available from 2012 to 2017. We mapped all the instances where incidents were classified as “low alert” or “high alert,” which indicate a HAB event is in progress.
Virginia
We reached out to staff at the Department of Health and asked for a database of HAB events in Virginia from 2008 to 2018. Staff sent us data from 2007 to 2014, and from 2016 to 2018. For 2011, 2012, and 2013, we mapped the events where a HAB was reported, according to the spreadsheets. For 2014, 2016, 2017, and 2018, we mapped the samples that showed cyanobacteria cell counts above the 2003 World Health Organization threshold (≥20,000 cells/mL). The 2008 and 2009 spreadsheets and the 2010 HAB report provided sample data from marine ecosystems, not freshwater, so no data from those three years are mapped.
West Virginia
We reached out to the Department of Environmental Protection (DEP) and asked for a database of HAB events in West Virginia from 2008 to 2018. Staff informed us that they do not have a historical database, but they do have a database of instances in 2015, 2017, and 2018 when DEP investigated a HAB report. We mapped only 2018 data because those data points indicate microcystin concentrations. We mapped the samples that showed microcystin concentrations ≥6μg/L, which is the state’s threshold.
Wisconsin
We reached out to staff at the Department of Natural Resources and asked for a database of HAB events in Wisconsin from 2008 to 2018. Staff said they do not have such a database. Hence there were no data to map for Wisconsin.
Washington
We reached out to the Department of Ecology (DEC) and asked if its Toxic Algae website contains the most comprehensive HAB data for Washington. Staff confirmed this, and we downloaded all the cyanotoxin sampling data from 2008 to 2018. We used Google Maps to find coordinates for the water bodies. We used the state’s cyanotoxin thresholds to filter the sample data we downloaded, and we mapped the HAB events that met or exceeded those thresholds.
Wyoming
We reached out to the Department of Environmental Quality and asked for a database of HAB events in Wyoming from 2008 to 2018. Staff said there is no database that lists HAB events, but that the department’s website has memos that detail HAB events in Wyoming. We then asked if the state collects any microcystin data through its routine monitoring program. Staff asked that we submit a Records Request Form for microcystin and other cyanotoxin sampling data from 2008 onward, which we did. We received microcystin data from 2017 and 2018 and mapped the events where the microcystin concentrations exceeded the state’s threshold.
2019 Methodology Update
Special Circumstances Acknowledgement
State agencies are responding to an unprecedented public health pandemic. For many states, those same state departments of health are also involved in responding to harmful algal bloom (HAB) requests. We want to take this opportunity to thank all the agency staff who were able to respond to our questions and requests while also attending to the very real public health needs of their residents. The responses to these questions are based on pre-pandemic circumstances, and it is very likely that future state funding and resources normally allocated for HAB response and monitoring will be eliminated or redirected to address public health concerns. Several agency staff shared that response protocols, maps showing where HAB events are, water quality sampling efforts, and data that would have already been uploaded are being put on hold due to COVID-19 delays. We do our best to flag these instances in our scorecard.
2019 Data Update
We followed the same process for collecting 2019 freshwater HAB data that we used in collecting data from 2008 to 2018. For states that sent us data last year, we asked for the same information on HAB events during 2019. For states that did not send us data last year, we asked whether they had data from 2008 to 2019. In this round of data collection, we did not receive data from the following 14 states: Alabama, Alaska, Arkansas, Connecticut, Delaware, Georgia, Hawaii, Louisiana, Maine, Mississippi, South Dakota, Tennessee, Texas, and Wisconsin.
We also asked agency staff to clarify what thresholds were in effect for the state in 2019, since the U.S. Environmental Protection Agency (EPA) published new thresholds for recreational exposure to cyanotoxins (microcystin and cylindrospermopsin) in 2019. States either changed their thresholds to the 2019 EPA recommendations, did not change their thresholds for the 2019 HAB season, or have yet to adopt any thresholds for recreational exposure to cyanotoxins. Three filtering processes were used:
- For states that changed their thresholds, we used those new 2019 values to filter data sent by the state agency.
- For states that have adopted thresholds, but did not change them to reflect EPA’s 2019 recommendations, we deferred to the state established threshold.
- For states that have not yet adopted cyanotoxin thresholds, we filtered data received using the 2019 EPA recommendations.
Two states did not provide us data last year and did this year: Colorado and Nevada. The method for mapping their HAB events are summarized below.
Last year, Oklahoma shared reports of HABs on public water supply waterbodies that can also be used for recreation, which were not mapped. We included that historic data in this year’s update, in addition to 2019 data shared with us.
Colorado
We reached out to staff at the Colorado Department of Public Health and Environment and asked for a database of HAB events in Colorado from 2008 to 2019. Staff sent us data from 2019. We filtered data using the state’s recommended values in 2019 (microcystin ≥ 4 ug/L, cylindrospermopsin ≥ 8 ug/L, anatoxin ≥ 8 ug/L, saxitoxin ≥ 4 ug/L) and mapped those events.
Nevada
We reached out to staff at the Nevada Division of Environmental Protection and asked for a database of HAB events in Nevada from 2008 to 2019. Staff sent us data from 2018 and 2019. Since the state has not adopted thresholds for recreational exposure to cyanotoxins, we filtered data using EPA’s recommended values. For 2018 data, we mapped events that exceeded EPA’s 2017 thresholds (microcystin ≥ 4 ug/L). For 2019 data, we mapped events that met or exceeded EPA’s 2019 recommended thresholds (microcystin ≥ 8 ug/L).
Oklahoma
We reached out to staff at the Oklahoma Department of Environmental Quality (DEQ) and asked for a database of HAB events in Oklahoma from 2008 to 2018. We were sent water sample data from 2019, and a list of waterbodies where Oklahoma DEQ staff responded to a HAB report from 2011 to 2018. We mapped all the events from 2011 to 2018. For 2019 data, according to state statue, the state uses the “moderate” threshold published by the World Health Organization (WHO). We filtered the 2019 data using the WHO’s moderate threshold and mapped those events. There were four events from 2019 for which we could not find latitude and longitude information based on the name of the waterbody, and therefore could not map. Those four waterbodies are: 1st Cove S. of Bridge Edmond; 2nd Cove Edmond; Dam, Edmond; and Penn Cove, Edmond.
Scorecard Update
We followed the same process to answer each scorecard question. Last year, there were times in which we had to correspond with agency staff for responses to questions because we could not find answers to those questions online. However, since then, states updated their websites and provided responses to questions that we previously had to email agency staff about. In these cases, we updated the scorecard responses and provided links to where answers can be found. For questions that we reached out to agency staff for and did not receive responses, we deferred to last year’s answers. We prefaced those responses with “No response from agency staff this year. Last year, the answer to the question was:”
Each state is given a score of “poor,” “fail,” “satisfactory,” “good,” or “excellent,” in four categories: accessibility of information, response protocol, data collection and use, and public outreach. Download the consolidated scorecard results here.
Download state harmful algal bloom data, including date and waterbody, at the time of our study.
1. Museum of Paleontology, University of California at Berkeley, “Cyanobacteria: Life History and Ecology,” https://ucmp.berkeley.edu/bacteria/cyanolh.html (accessed May 29, 2019).
2. United States Government Accountability Office, “Environmental Protection: Information on Federal Agencies’ Expenditures and Coordination Related to Harmful Algae,” October 2016, https://www.gao.gov/assets/690/680457.pdf.
3. Ibid.
4. U.S. Environmental Protection Agency (hereinafter EPA), “Cyanobacteria and Cyanotoxins: Information for Drinking Water Systems,” September 2014, https://www.epa.gov/sites/production/files/2014-08/documents/cyanobacteria_factsheet.pdf.
5. Wayne W. Carmichael and Gregory L. Boyer, “Health Impacts from Cyanobacteria Harmful Algae Blooms: Implications for the North American Great Lakes,” Harmful Algae 54 (April 2016): 194–212, https://doi.org/10.1016/j.hal.2016.02.002.
6. National Institute of Environmental Health Sciences, “Harmful Algal Blooms,” https://www.niehs.nih.gov/health/topics/agents/algal-blooms/index.cfm (accessed May 29, 2019).
7. EPA, “Hypoxia 101,” Overviews and Factsheets, March 24, 2015, https://www.epa.gov/ms-htf/hypoxia-101.
8. R. M. Kudela et al., Harmful Algal Blooms: A Scientific Summary for Policy Makers, GEOHAB, 2015, https://meetings.pices.int/publications/other/members/HAB-PolicyMakers.pdf.
9. EPA, “Recommendations for Cyanobacteria and Cyanotoxin Monitoring in Recreational Waters,” June 2017, https://www.epa.gov/sites/production/files/2017-07/documents/08_july_3_monitoring_document_508c_7.5.17.pdf.
10. Keith A. Loftin et al., “Cyanotoxins in Inland Lakes of the United States: Occurrence and Potential Recreational Health Risks in the EPA National Lakes Assessment 2007,” Harmful Algae 56 (June 2016): 77–90, https://doi.org/10.1016/j.hal.2016.04.001.
11. EPA, “Harmful Algal Blooms,” Collections and Lists, June 3, 2013, https://www.epa.gov/nutrientpollution/harmful-algal-blooms.
12. Laura Gatz, Freshwater Harmful Algal Blooms: Causes, Challenges, and Policy Considerations, Congressional Research Service, August 20, 2018, 29, https://fas.org/sgp/crs/misc/R44871.pdf.
13. U.S. Congress, “H.R. 2204: Coast Guard Authorization Act of 1998,” Pub. L. No. 105–383, § 601, 40 (1998), https://www.congress.gov/105/plaws/publ383/PLAW-105publ383.pdf.
14. Laura Gatz, Freshwater Harmful Algal Blooms.
15. EPA, “Recommendations for Cyanobacteria and Cyanotoxin Monitoring in Recreational Waters.”
16. Ibid.
17. Ibid.
18. EPA, “Human Health Recreational Ambient Water Quality Criteria or Swimming Advisories for Microcystins and Cylindrospermopsin—Draft,” no. 822-P-16–002 (December 2016): 185, https://www.epa.gov/sites/production/files/2016-12/documents/draft-hh-rec-ambient-water-swimming-document.pdf.
19. Federal Communications Commission, “Degrees Minutes Seconds to/from Decimal Degrees,” December 11, 2015, https://www.fcc.gov/media/radio/dms-decimal.
20. EPA, “Recommended Human Health Recreational Ambient Water Quality Criteria or Swimming Advisories for Microcystins and Cylindrospermopsin Documents,” Reports and Assessments, May 22, 2019, https://www.epa.gov/wqc/recommended-human-health-recreational-ambient-water-quality-criteria-or-swimming-advisories.
Related Content
Freshwater Harmful Algal Blooms 101

6 Ways You Can Help Keep Our Water Clean

Tides of Trouble: Increased Threats to Human Health and Ecosystems from Harmful Algal Blooms
Can the Great Lakes Become Fishable, Drinkable, and Swimmable Again?
Why Are Our Waters Turning Green?

The Algae That (Almost) Ate Toledo

Industrial Agricultural Pollution 101

As Water Pollution Grows, Healthy Soil Comes to the Rescue

How the Dairy Industry Is Fouling the Drinking Water of These Wisconsinites
Water Pollution: Everything You Need to Know

CAFOs: What We Don’t Know Is Hurting Us
Related Resources

A Fund for Cleaning Up Coal Mining’s Toxic Legacy Dries Up

Need-Based Use Programs for Insecticides Work: Protect Our Health and the Environment, Save Insecticide Seed Coatings for Real Pest Problems
