Holding the U.S. LNG Industry Accountable
NRDC’s informational cards outline the environmental and financial harms of the United States’ 10 largest LNG companies.
For years, methane gas has been erroneously touted as a reliable energy source for countries to achieve a low-carbon future. This myth was readily dispelled in NRDC’s prior publications, Sailing to Nowhere and Risky Business, where we emphasized the negative climate impact from methane gas and its supercooled form, liquefied natural gas (LNG). Despite this, the U.S. LNG industry—headed by 10 large U.S. companies—continues to expand and profit without being held accountable for its environmental impacts.
In the first half of 2022, the United States became the world’s largest exporter of LNG for the first time. It temporarily lost this position, due to the June 2022 explosion at the Freeport LNG facility in Texas, but it was back on top by 2024. The U.S. Energy Information Administration found that U.S. LNG exports averaged 11.9 billion cubic feet per day (Bcf/d) in 2024, with LNG gross exports expected to increase by up to 19 percent to 14.2 Bcf/d in 2025 and by a further 15 percent to 16.4 Bcf/d in 2026. As the United States continues to play a critical role in the supply, development, and financing of LNG expansion worldwide, it is set to double its capacity for LNG exports from 2023 levels by the end of 2027.
According to the U.S. Department of Energy (DOE), projected increases in LNG exports could drive direct life cycle greenhouse gas (GHG) emissions of all U.S. LNG to 1.5 gigatons of CO2 equivalent (CO2e) in 2050. The DOE under the Trump administration continues to approve permits to build new LNG export terminals, disregarding the frontline communities that bear the brunt of the LNG industry’s detrimental climate, public health, and broader environmental justice harms.
Learn More


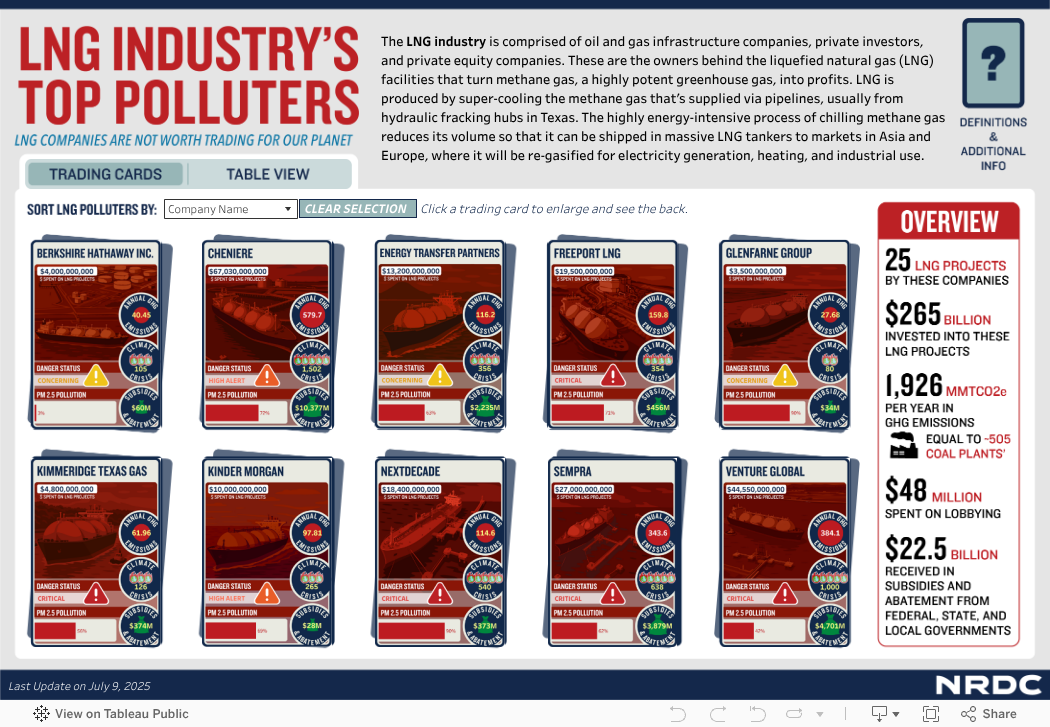
In response, NRDC’s industry accountability project critically examines the 10 main parent companies behind the U.S. LNG export industry. Data on the companies and owners have been compiled and distilled into this industry accountability card series that highlights the top-line environmental and human impacts of the U.S. LNG industry and the companies that profit from its expansion. These figures reveal the staggering amount of financial resources dedicated to the destructive U.S. LNG industry. These 10 companies alone are investing $265 billion into their 25 projects, accounting for 1,926 million metric tons of CO2e (MMTCO2e) per year, which is equivalent to the emissions of 505 coal plants.
Below, we elaborate on the data sources, research, and methodology so you can know how to interpret each LNG company card. Our hope is to shine a spotlight on these companies’ rampant climate and environmental pollution and their actions against the public interest.
Data sources
We collated data on U.S. LNG export terminal projects and provided details about the project’s size, investment sources, government permitting status, offtake customers, and expected delivery dates with publicly available information from various databases. Sources include the DOE e-Docket Room and the Federal Energy Regulatory Commission (FERC) eLibrary database, and the Global Energy Monitor (GEM) Wiki. We also cross-referenced investments and offtake customers with available company press releases. From the list of all U.S. LNG export terminals, we focused on terminal owner companies that are headquartered in the United States and have a majority stake in the project(s). We excluded from the top 10 companies where there was limited data on the companies or movement on the LNG projects in their portfolios.
Data on particulate matter 2.5 (PM2.5) national percentiles and GHG emissions were extracted from the Sierra Club U.S. LNG Export Tracker tool. We searched for past and active litigation and public campaigns associated with the U.S. LNG export terminal projects. NRDC participates in meetings with frontline organizations to stay up to date on LNG projects of high priority for grassroots campaigns and community intervention. Information about the companies’ lobbying contributions and sponsorships to industry conferences and events was found from the OpenSecrets database and collated from industry event sites. Information about tax incentives given in Louisiana and Texas to LNG companies were from the Good Jobs First Subsidy Tracker, a report by Autocase and the Coastal Alliance to Protect Our Environment, and a report released by Sierra Club and partners.
How to read the industry accountability trading cards
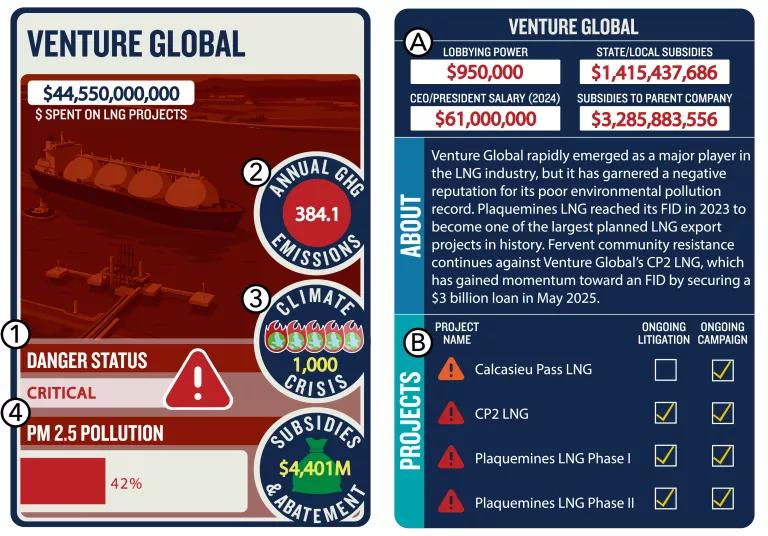
The industry accountability trading cards emphasize the climate, environmental justice, and extractive costs of the U.S. LNG industry. The left-hand side of each card builds the company profile based off of (1) the LNG polluter danger status, (2) annual GHG emissions, (3) the climate crisis score, and (4) the PM2.5 pollution indicator. The right-hand side of the card describes the company and its projects as well as (A) some of the top-line financial flows that enable the expansive U.S. LNG industry developments (namely the lobbying, subsidies, and CEO salaries) and (B) project links to ongoing campaigns and litigation spearheaded by organizations and partners like NRDC. This resource page helps to break down the methodology and reasoning behind these figures in detail.
Left-hand side
LNG Polluter Danger Status: Concerning (yellow), high alert (orange), and critical (red) rankings
As of January 2025, there are more than 50 pending and approved U.S. LNG export permits to non–Free Trade Agreement countries. Each LNG export project is given a qualitative ranking based on whether it is a greenfield or brownfield project, a new project, or an expansion of an existing project, and whether the project is on track to receive all of its permits and financing. Each LNG project will fall into one of the three ascending categories: concerning, high alert, and critical. A project that is closer to final investment decision (FID) means that there is greater urgency for communities and NGOs to intervene. Each company’s overall danger status is based on a tally of how many of its projects fall within each of these three categories.
GHG Emissions: Annual GHG emissions from all company LNG projects
Understanding the annual GHG emissions from all of the U.S. LNG projects sheds light on how each U.S. LNG company is adding GHG emissions to the atmosphere. Additional projects backed by these companies are contrary to the Paris Agreement goals to limit global warming. It further contravenes the recent COP28 decision acknowledging the need to transition away from fossil fuels in energy systems in a just, orderly, and equitable manner to achieve net zero by 2050.
The GHG emissions figure on the front of each company’s industry accountability trading card is derived from the Sierra Club U.S. LNG tracker.1 Under the emissions tab, the Sierra Club LNG tracker estimates annual emissions in million metric tons of CO2e (MMTCO2e) for each project (which is a life cycle estimate that includes emissions from upstream gas extraction processes, liquefaction, shipping, regasification, and combustion for electricity).
Every trading card sums up the total annual GHG emissions by each LNG company from all the projects it owns or operates. The summed figure includes projects that are operational and future projects in development or construction. Generally, any LNG project that does not have a calculated estimate of GHG emissions is not reflected in the company’s GHG emissions figure.
Climate Crisis: On a scale from 1–5, a ranking of the total million tons of methane gas produced from an LNG polluter company
According to the International Energy Agency’s road map for the global energy sector to reach net zero GHG emissions by 2050, there can be no new fossil fuel exploration or new oil and gas fields beyond those that have already been approved for development. Regardless, the U.S. LNG industry is seeking more gas supply and to construct new LNG terminals against the IEA’s recommendations, creating longer-term fossil fuel lock-in that detracts from the Paris Agreement goals.
The industry accountability trading card illustrates the contributions of each LNG company to the climate crisis by prolonging a fossil fuel–dominated energy future. We summed up all of the LNG projects’ maximum capacity of methane gas, produced in million tonnes per annum (MTPA), and multiplied it by the longest known offtaker customer contract term to determine the expected lifetime output of methane gas from the company. In the absence of readily available contract term durations, the default contract term multiplier was 20 years, as this tended to be the industry standard according to expert sources. Higher figures for the Climate Crisis score correspond to a greater number of burning planet icons, which ranges from one to five burning planet icons.

PM2.5 Pollution indicator: Averaged national percentiles of PM2.5
U.S. LNG export projects join the patchwork of industrial development along the U.S. Gulf Coast and “Cancer Alley,” the petrochemical corridor stretching from New Orleans to Baton Rouge in Louisiana. As petrochemical industry facilities replace the vibrant coastal ecosystems that sustain local communities’ traditional livelihoods (e.g., in fishing, tourism, agriculture), these areas have become natural resource “sacrifice zones,” with severe environmental pollution burdens that disproportionately affect communities of color. The PM2.5 indicator illustrates how LNG companies are siting facilities in communities that are already exposed to serious and cumulative health risks.
The Sierra Club LNG tracker’s Environmental Justice tab compares areas within 3 miles of the boundaries of the LNG terminal sites with national census block group communities for environmental justice indicators. Its data are from the former U.S. Environmental Protection Agency’s EJScreen tool, derived from 2020 tract-level source data, which were removed from public use on February 5, 2025. We used the Sierra Club LNG tracker’s national percentiles for PM2.5 pollution for the location of each project2 and took the average of all the company’s projects. This value does not indicate pollution resulting from the LNG facilities themselves; rather, it points to where a company’s LNG facilities are being located in communities that are already overburdened with high exposure to toxins and particulates in the air that residents breathe.
Right-hand side
The right-hand side of each industry accountability trading card gives a thorough breakdown of the U.S. LNG company and its U.S.-sited export projects. It includes a basic description of the company as well as its financials and a quick tally of the resistance against the company’s projects in litigation and public campaigns.
Financials: Lobbying power, CEO salaries, tax abatements, and subsidies
For decades, the fossil gas industry has benefited from a suite of subsidies, tax abatements, and preferential regulations in Louisiana and Texas. The financial and regulatory ecosystems that sustain U.S. LNG export expansion did not materialize out of nowhere; these LNG companies pour out massive amounts of lobbying money to secure their interests. Their CEOs receive high salaries far greater than the median household income in Louisiana3 and Texas4, demonstrating the profits they gain while leaving communities to bear the brunt of environmental and health burdens from the expanding U.S. LNG industry. States are providing billions in fossil fuel subsidies to each U.S. LNG company when such financial resources could be channeled toward Paris Agreement–aligned clean energy development in the United States.
LNG Projects: Litigation and campaigns
Ongoing controversies surrounding U.S. LNG companies or their project(s) create negative reputational risk that is detrimental to the advancement of a project’s final investment decision. The right side of each industry accountability trading card flags any known litigation or public campaign against each project; actions that are usually advanced by frontline groups and coalitions advocating against U.S. LNG export expansion.
Conclusion
In summary, NRDC’s U.S. LNG industry accountability cards are a digestible way to understand the U.S. LNG industry’s impacts and where these companies are profiting to the detriment of frontline communities in the U.S. Gulf Coast as well as the planet. They further demonstrate that U.S. LNG export permit approvals are not in the public interest and more should be done to prevent further fossil fuel lock-in in the United States and abroad.
1Estimated life cycle GHG emissions for an LNG project as determined by Sierra Club methodology. These estimates are based on values from a 2024 Howarth research paper (DOI: 10.1002/ese3.1934) on LNG life cycle emissions, using the 20-year global warming potential (GWP) of methane. Researchers used a 20-year GWP (rather than a 100-year GWP) to reflect the near-term timeline on which we must act to reduce emissions. Sierra Club researchers applied the emissions values from the Howarth paper to each project’s peak capacity in Bcf/d as reported in FERC/MARAD materials. Where these materials were not available, peak capacity figures from DOE applications were used. Where these were not available, the capacity as stated by the developer was used, as reported in public-facing materials and press releases. Emissions units are annual million metric tons of carbon dioxide equivalent (MMTCO2e). To convert the GHG estimates to equivalent emissions from coal plants or cars, they used the EPA’s GHG Equivalencies Calculator. See Sierra Club U.S. LNG Export Tracker, Glossary.
2From Sierra Club’s U.S. LNG Export Tracker Glossary: National percentile (Natl Pctl) comparing the yearly average particulate matter 2.5 (ug/m3) pollution for census block group communities within a 3-mile radius of the LNG project and all census block groups in the United States. This particulate matter is microscopic, can be solid or liquid, and can be inhaled deep into the lungs or enter the bloodstream. This can result in serious, negative health impacts. “A national percentile represents what percentage of the U.S. population lives in a block group with an equal or lesser value for that indicator/index.” (Source: EPA EJScreen v2.3, N_E_PM25_PER)
3The median household income in Louisiana is $60,023 in 2023 dollars (accessed May 29, 2025).
4The median household income in Texas is $76,992 in 2023 dollars (accessed May 29, 2025).
Related Resources

The EPA Doubles Down on Science Denial to Undo Climate Protections

From Shadows to Light: Spotlighting Major Companies in the U.S. Liquefied Natural Gas Industry