Dirty Water: Toxic “Forever” PFAS Chemicals Are Prevalent in the Drinking Water of Environmental Justice Communities

iStock
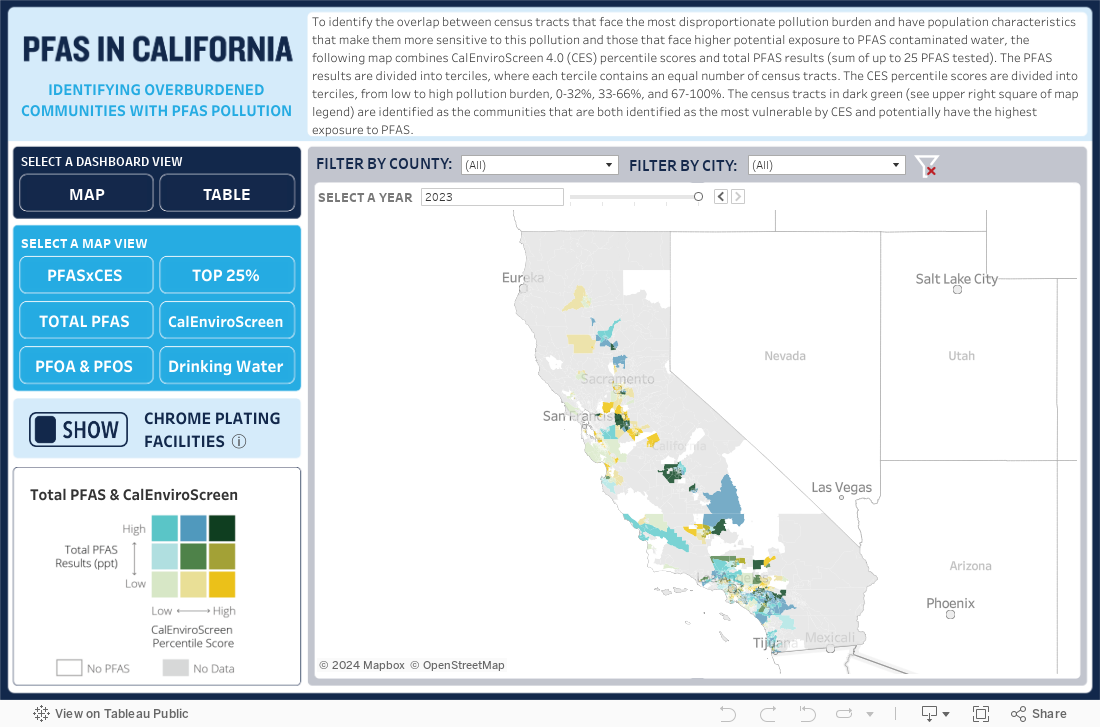
NOTE (February 2024): We have updated the interactive tool below to include PFAS drinking water testing results in California from 2019–2023. A table view has also been added to assist in exploring and comparing the data available. Updated summary findings are below.
Per- and polyfluoroalkyl substances (PFAS) are toxic chemicals that have been linked to multiple serious health harms, such as cancer and developmental and reproductive harm. Unfortunately, PFAS are widely used in everyday products such as nonstick cookware, water-resistant clothing, and food packaging. Even worse, PFAS are very resistant to breaking down and can accumulate to dangerously high levels in the human body. Monitoring shows that virtually all people residing in the United States have some level of PFAS in their bodies.
California is working to address this public health and environmental crisis through a series of investigations of potential PFAS contamination sites, including monitoring drinking water sources near landfills, wastewater treatment plants, oil and gas facilities, metal plating facilities, and airports. In 2021, NRDC analyzed the initial data from this monitoring program, with a particular focus on data related to drinking water in overburdened communities. Our findings are reflected in the report here. These investigations revealed that PFAS pollution in California is widespread throughout the state, but more prevalent in communities already overburdened by multiple sources of pollution and by other factors that make them more sensitive to pollution, putting those vulnerable communities at greater risk of harm from PFAS exposure. Our analysis from 2021 found that at least 69 percent of state-identified disadvantaged communities have PFAS contamination in their public water systems. Almost a quarter of these communities face the highest levels of PFAS contamination in the state.
In February 2024, we updated our analysis to include testing results from 2019 to 2023. This new data can be explored below in the interactive maps and tables. Here are the main findings:
- From 2019–2023, PFAS have been found in water systems serving up to 25.4 million Californians (approximately 64 percent of population).
- 8.9 million Californians living in state-identified disadvantaged communities are being served by water systems that have or have had PFAS contamination (approximately 79 percent of the people living in these communities).
- 2.3 million Californians living in these communities face or have faced the highest levels of PFAS contamination (top quartile of total PFAS levels; approximately 20 percent of people living in state-identified disadvantaged communities).
- The percentage of water systems that have been tested for PFAS has increased from approximately 3.3 percent in 2019 to 8.7 percent in 2023. Because many of the systems tested are large, this 8.7 percent covers approximately 28.7 million Californians (73 percent). As testing continues, the percentage of Californians potentially affected by PFAS-contaminated water will likely grow.
Action is urgently needed to protect Californian communities—especially those already overburdened with cumulative exposure to multiple different types of pollution—from these ubiquitous chemicals. The state must continue to take steps to ensure that all Californians have access to clean water by improving monitoring and testing for PFAS, cleaning up contaminated water, providing clean water to disadvantaged communities in the interim, and eliminating nonessential uses of PFAS in products and applications.
The interactive tool below includes a series of interactive maps and tables showing the relationship between PFAS drinking water pollution and indicators of existing pollution burdens. The maps allow users to explore drinking water testing data at the census tract level. To better understand the impacts of PFAS drinking water contamination on communities with existing pollution burdens, we incorporated data from CalEnviroScreen 3.0 (CES) into our analysis. CES scores—developed by the California Environmental Protection Agency and based on geographic, socioeconomic, public health, and environmental hazard criteria—identify communities that are disproportionately burdened by and vulnerable to multiple sources of pollution. The higher the CES score, the greater the burden. For more information on the data presented and how it was collected and analyzed, please see the report (link below the tool).
Downloads
Related Resources

CA PFAS Pollution Widespread in Disadvantaged Communities

Living on the Frontlines of Fumigation Facilities in Los Angeles County
