Data, Reports & Resources
NRDC is a leader and trusted source in environmental policy and research.
From reports to issue briefs, we ensure accountability through peer review led by our Science Office, which provides data and scientific analysis that help shape and guide NRDC’s policies and positions. We also offer a range of other resources, such as 101 guides and consumer-focused scorecards to increase access to knowledge about how everyone can be a catalyst for change.
Skip carousel items
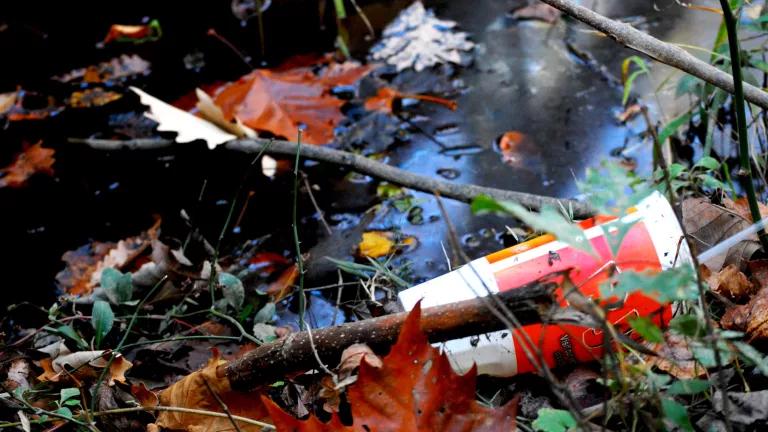

Single-Use Plastics 101
GuideUnited StatesCourtney Lindwall
Here’s everything you need to know about the most ubiquitous (and avoidable) kind of plastic waste: the kind made to be tossed in mere minutes.
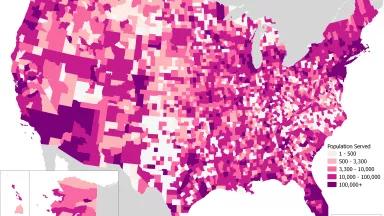
Will Funds for Water Infrastructure Flow Fairly?
ReportUnited StatesBecky Hammer, Erik D. Olson
These report cards grade all 50 states on water funding equity.
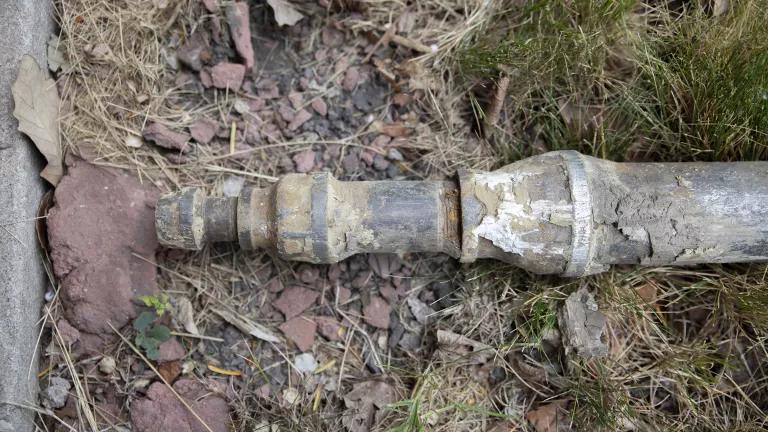
Getting the Lead Out: Removing Lead Pipes Would Yield Hundreds of Billions of Dollars in Health Benefits
Issue BriefUnited StatesErik D. Olson
Removing lead service lines could save the United States an estimated $786 billion from avoided health impacts over the next 35 years.