Data, Reports & Resources
NRDC is a leader and trusted source in environmental policy and research.
From reports to issue briefs, we ensure accountability through peer review led by our Science Office, which provides data and scientific analysis that help shape and guide NRDC’s policies and positions. We also offer a range of other resources, such as 101 guides and consumer-focused scorecards to increase access to knowledge about how everyone can be a catalyst for change.
Featured Data, Reports & Resources
Skip carousel items


White House Watch: Tracking Attacks on Our Environment & Health
OverviewUnited States
Since the Trump administration took office in January 2025, it has taken or proposed at least 480 actions that directly threaten the environment, climate, and human health. NRDC is tracking the mounting hazard and harm.
An Uninsurable Country
ReportUnited StatesRob Moore
States must take action to fend off the looming home insurability crisis.
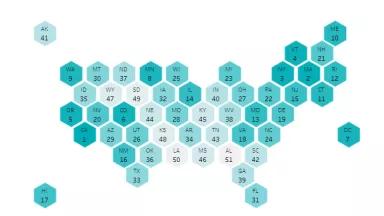
How States Stack Up on Oil and Gas Regulation
ReportUnited StatesAmy Mall
A new NRDC report reviewed regulations in the 12 largest oil- and gas-producing states and found that states are not consistently stepping up to fill regulatory gaps and protect communities.
Viewing 1 - 20 of 21